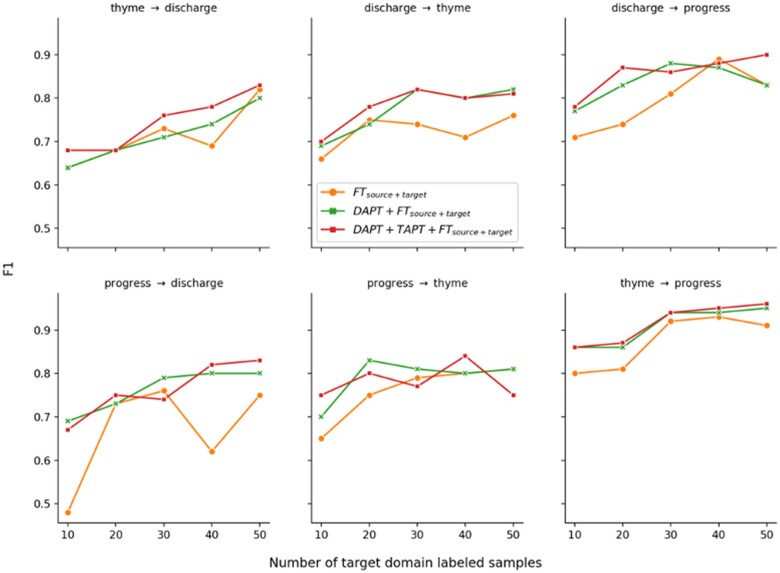
Figure 1.
F1 scores of FTsource + target, DAPT + FTsource + target, and DAPT + TAPT + FTsource + target with 10, 20, 30, 40, and 50 target domain samples for different source and target domain experiments. For example, thyme → discharge represents the experiment with thyme being the source domain and discharge being the target domain.

