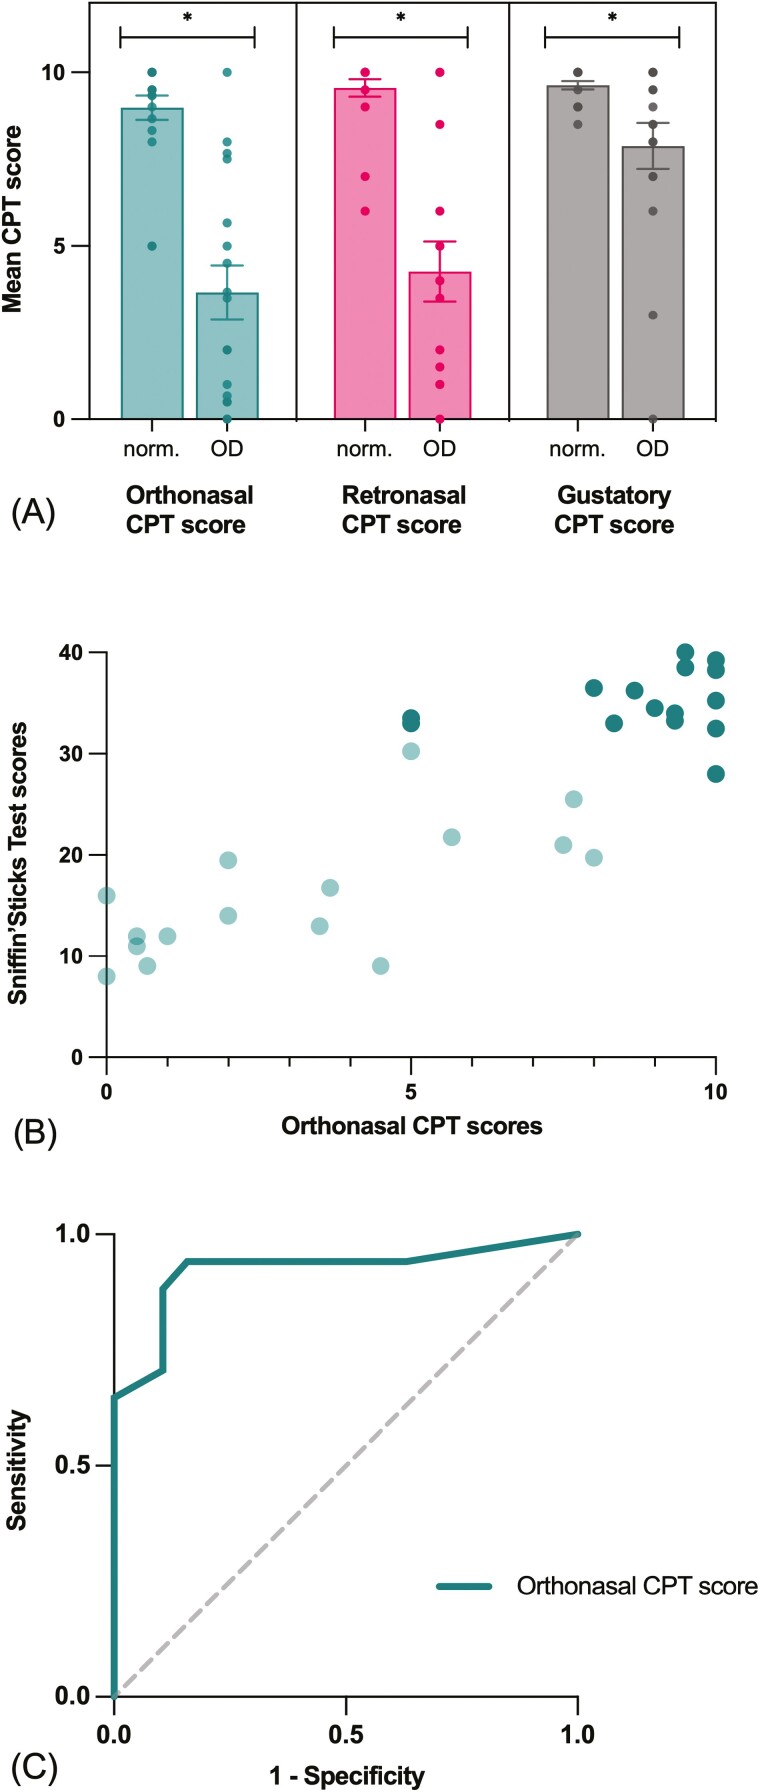
Fig. 2.
CPT subscores compared with SST in Experiment 1. (A) Mean orthonasal, retronasal and gustatory CPT scores in participants with normosmia (norm.) or OD according to SST scores. Data presented as jittered dots (visibility: 0.8). Significant difference between groups (P < 0.05) is represented with *. (B) Correlation between SST and orthonasal CPT scores (ρ = 0.84, P < 0.001). Darker points indicate participants with normosmia (SST TDI > 30.5); lighter points indicate participants with olfactory dysfunction (SST TSI < 30.5). (C) Orthonasal CPT score accuracy in detecting olfactory dysfunction according to SST scores (AUC: 0.923 [95% CI, 0.822–1.000], P < 0.001).

