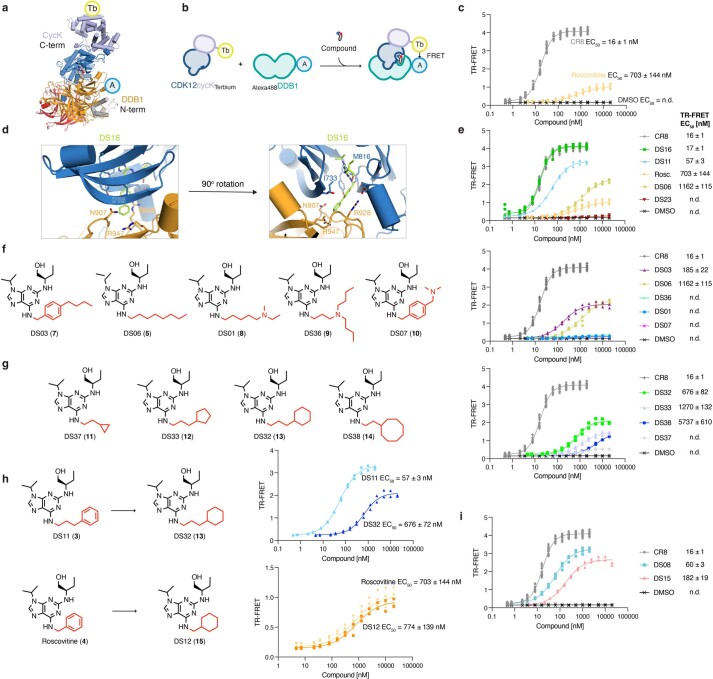
Extended Data Fig. 1. Mapping of interfacial pocket dimensions and key interactions with CR8 derivative series.
a, Fluorescent label positions chosen for the optimized TR-FRET assay. b, Schematic of the compound titration used for ternary complex formation assessment. c, Optimized in vitro TR-FRET complex formation assay for CR8 and roscovitine reveals a large difference in activity (much larger than previously reported15) between the two compounds in accordance with the lack of cyclin K degradation activity of roscovitine in cells15. The assay is therefore an appropriately sensitive readout for the evaluation of closely related compounds. d, CDK12 loop (a.a. 731-743) that encloses the active site, with the Ile733 sidechain oriented towards the compound. This loop is omitted from most figure panels for clarity. e, In vitro TR-FRET complex formation assay for compound shown in Fig. 1c. f, Chemical structures of a series of derivatives bearing aliphatic chains at the R1 position listed from best to worst binder (left). In vitro TR-FRET complex formation assay for these compounds (right). g, Chemical structures of a series of derivatives bearing saturated rings at the R1 position listed from best to worst binder (left). In vitro TR-FRET complex formation assay for these compounds (right). h, The impact of aromaticity on ternary complex formation. Chemical structures of two aromatic-aliphatic pairs and the associated in vitro TR-FRET compound titration results. i, In vitro TR-FRET complex formation assay for compounds shown in Fig. 1d. Crystal structures with compounds DS08 and DS15 are displayed in Fig. 1e. (c, e-i) Individual replicates are shown (n = 17 for CR8; n = 4 for DS06, DS08, roscovitine; n = 2 for others).

