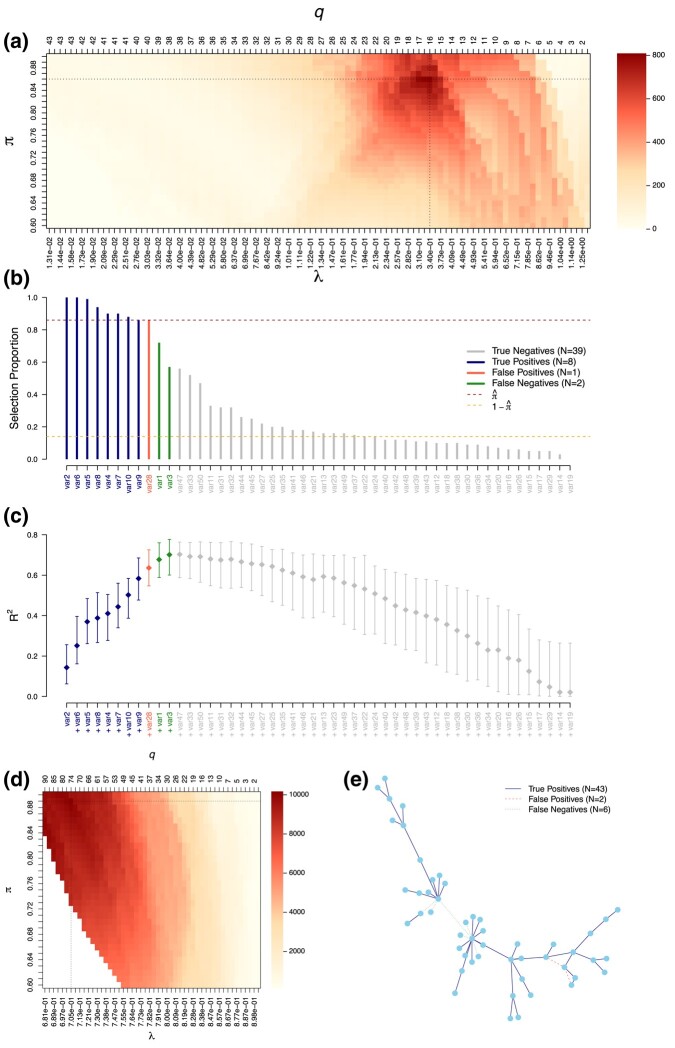
Figure 1.
Stability selection LASSO (a–c) and graphical LASSO (D–E) applied on simulated data. Calibration plots (a–d) show the stability score (colour-coded) for different penalty parameters λ, or numbers of features selected q, and thresholds in selection proportion π. We show selection proportions (b) and a graph representation of the detected and missed edges (e). We report the median, 5th and 95th quantiles of the obtained for 100 unpenalised regression models sequentially adding the predictors in order of decreasing selection proportions (c). These models are trained on of the data and performances are evaluated on the remaining observations. TPs, FPs, and FN are highlighted (b, c, e). Calibration of the stability selection graphical LASSO ensures that the expected number of false positives (PFER) is below 20 (d). The two datasets are simulated for variables and observations. For the regression model, 10 variables contribute to the definition of the outcome with effect sizes in and an expected proportion of explained variance of . For the graphical model, the simulated graph is scale-free.

