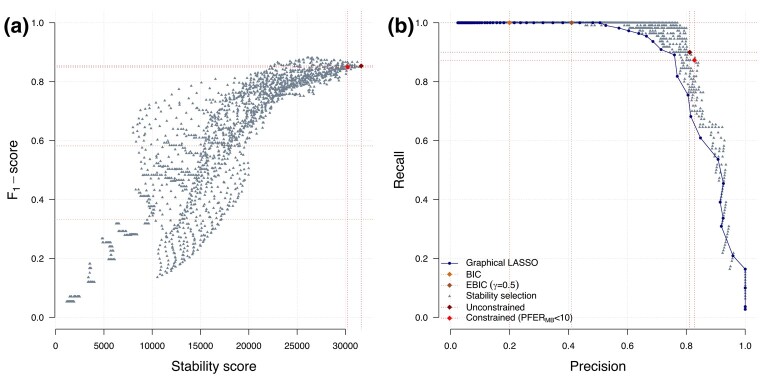
Figure 2.
Selection performance in stability selection and relevance of the stability score for calibration. The graphical LASSO and stability selection are applied on simulated data with observations for variables where the conditional independence structure is that of a random network with . The -score of stability selection models fitted with a range of λ and π values is represented as a function of the stability score (a). Calibrated stability selection models using the unconstrained and constrained approaches are highlighted. The precision and recall of visited stability selection models (grey) and corresponding graphical LASSO models (dark blue) are reported (b). The calibrated models using the BIC (beige) or EBIC (brown) are also showed (b).

