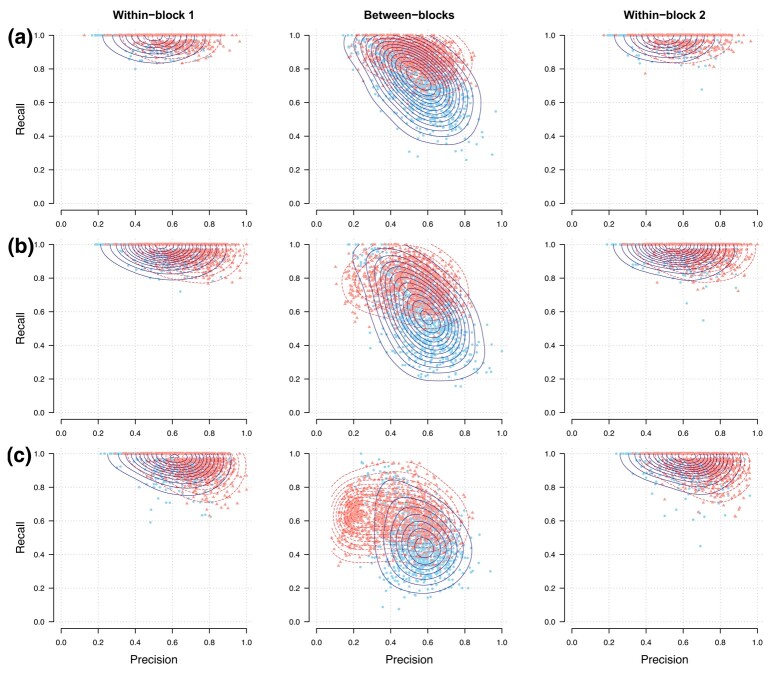
Figure 4.
Precision-recall showing single and multi-block stability selection graphical models applied on simulated data with a block structure. Models are applied on 1,000 simulated datasets (points) with variables following a multivariate Normal distribution corresponding to a random graph () and with known block structure (50 variables per group, using ). The contour lines indicate estimated two-dimensional density distributions. Performances are evaluated in low (a, ), intermediate (b, ), and high (c, ) dimensions.

