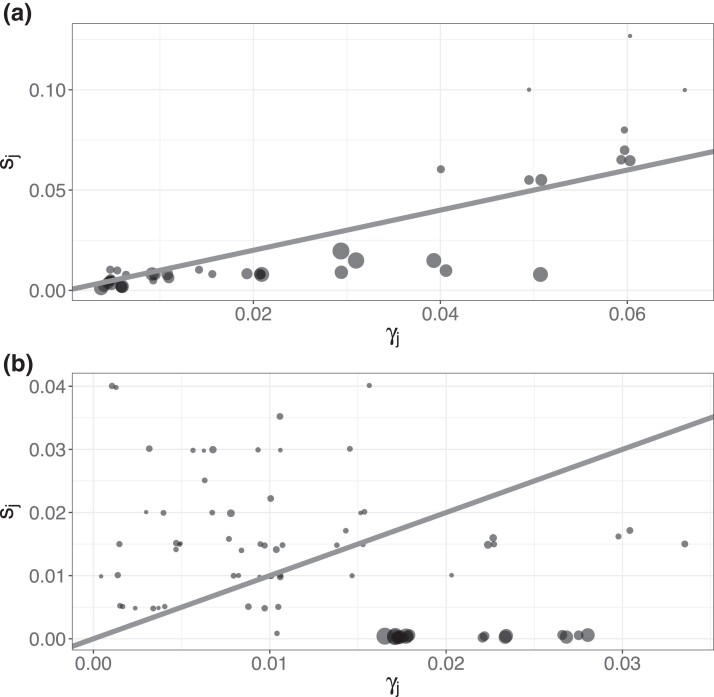
Figure 1.
Panels (a) and (b) represent selection bias in the simulation studies of data generating processes 3 and 4, described in Sections 4.3.1 and 4.3.2, respectively. Circle size is proportional to prevalence. Points are jittered slightly for legibility, and the diagonal lines denote equality between (stratum proportion) and (sampling probability).

