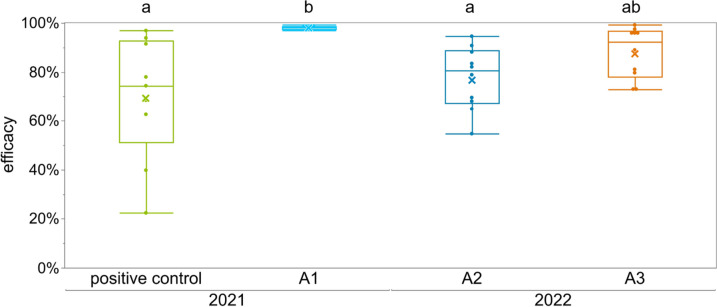
Fig. 4.
Efficacy of different LiCl administrations and positive control shown as box plots and mean by x. Positive control colonies (n = 9) were treated with 250 ml 60% formic acid. For A1 (n = 6) we applied 2.5 kg 50 mM LiCl candy over a period of 9 days; A2 colonies (n = 10) received 2 kg 50 mM LiCl candy in 5 days; for A3 (n = 10) we applied 0.5 kg of 50 mM LiCl candy four times in seven-day intervals (total of 2 kg candy) without caging the queen. Box plots with different letters are statistically different (Dunn’s test, p < 0.05, additional data are given in Online Resource 4)

