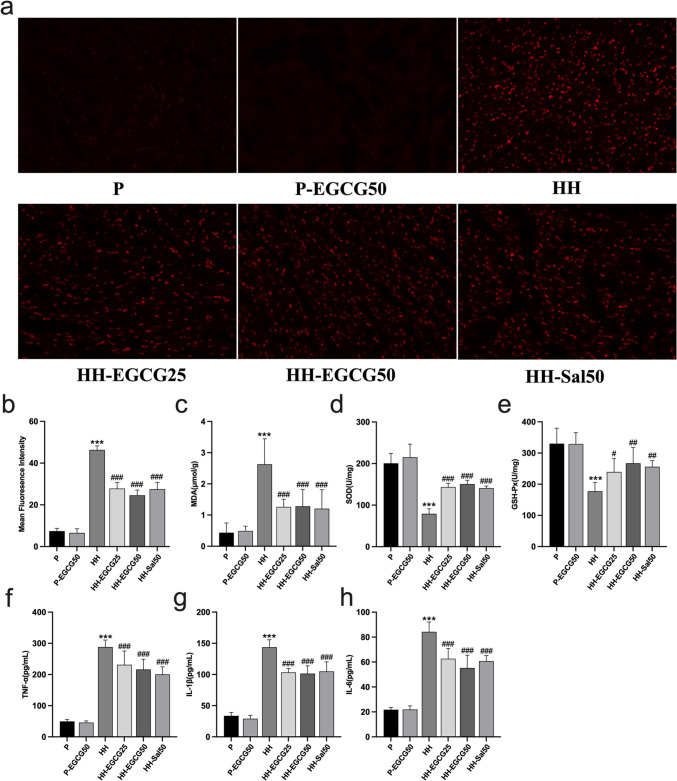
Fig. 4.
EGCG and salidroside ameliorated HH-induced oxidative stress and inflammatory responses. a ROS generation detected by DCFH-DA staining of the P, P-EGCG50, HH, HH-EGCG25, HH-EGCG50, and HH-Sal50 groups. b The values of fluorescence intensity which stand for level of ROS generation. c–e The concentration of MDA, SOD, and GSH-Px in the cardiac tissues, respectively. f–h Serum levels of pro-inflammatory cytokines including TNF-α, IL-1β, and IL-6, respectively. ***P < 0.001 compared with the P group; #P < 0.05, ##P < 0.01, and ###P < 0.001 compared with the HH group

