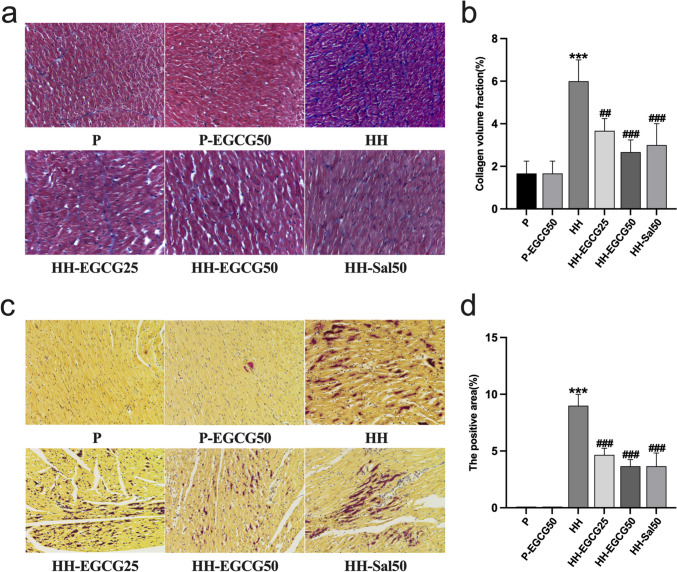
Fig. 5.
EGCG and salidroside reduced HH-induced myocardial fibrosis and myocardial hypoxia. a Representative photomicrographs of the P, P-EGCG50, HH, HH-EGCG25, HH-EGCG50, and HH-Sal50 groups stained with Masson’s trichrome (× 400). b Quantification of collagen volume fraction in the cardiac tissues. c Representative HBFP staining of the P, P-EGCG50, HH, HH-EGCG25, HH-EGCG50, and HH-Sal50 groups (× 200). d Quantification of the anoxic area in the cardiac tissues. The results are expressed as mean ± standard deviation (SD). ***P < 0.001 compared with the P group; ##P < 0.01 and ###P < 0.001 compared with the HH group

