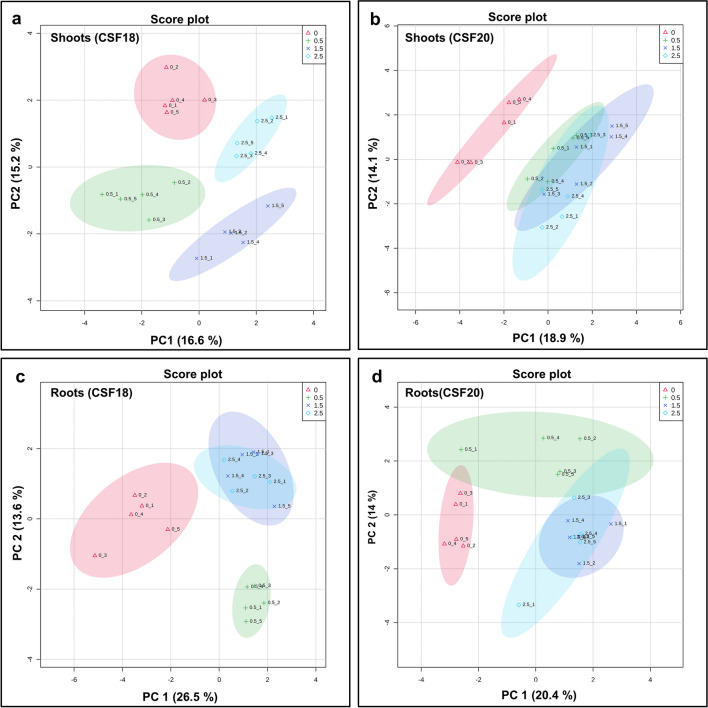
Fig. 4.
Principal Component Analysis (PCA) of metabolic profiling of shoots (a, b) and roots (c, d) sorghum varieties. CSF 18 is on the left and CSF20 is on the right, they were grown under 0 (control), 0.5 µg mL−1, 1.5 µg mL−1, and 2.5 µg mL−1 tunicamycin (TM). The ellipses indicate the 95% confidence interval of the groups

