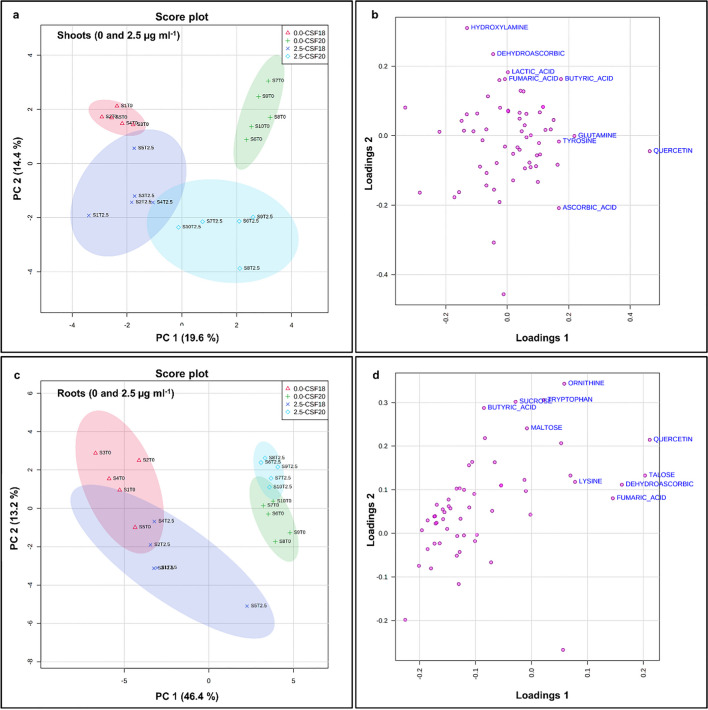
Fig. 7.
Principal Component Analysis (PCA) of metabolic profiling in two varieties of sorghum, analyzing shoots CSF18 and CSF20 (a) and roots CSF18 and CSF20 (c). The loading plot for shoot (b) and root (d) indicate the positive and negative contributions of each metabolite in two varieties of sorghum: CSF 18 e CSF20 under control and TM 2.5 µg mL−1. The ellipses indicate the 95% confidence interval of the groups

