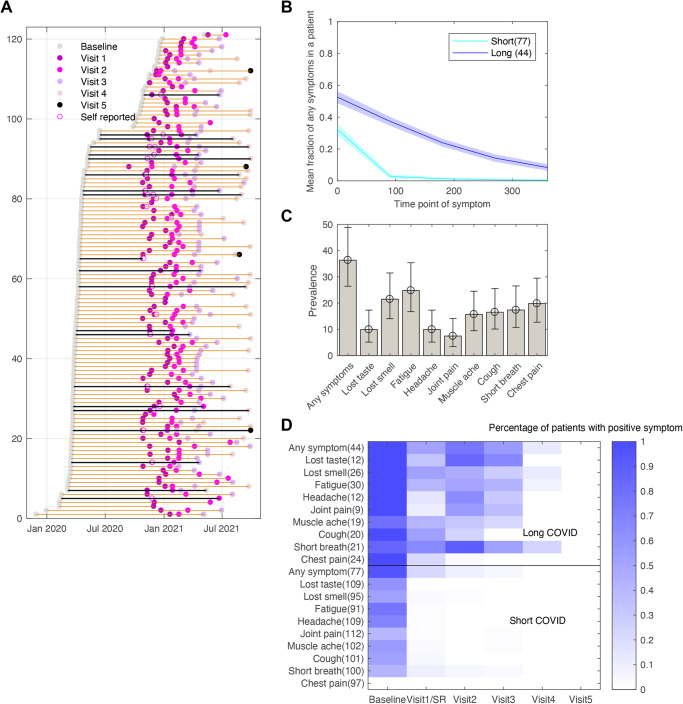
Fig. 2. Classification of reported COVID-19 symptom trajectories of 121 HCWs.
A Timeline of visits for each participant when the symptoms were reported. Black lines represent the patients who had physical activity data recorded as well. B Average estimated probability (with 95% confidence interval) of presence of any symptom over time of participants who were grouped as having short or long trajectory patterns. C Prevalence of the long-term symptom patterns along with 95% confidence interval. D Heatmap showing the probability of presence of a symptom at a particular visit for individuals in either the long or short COVID-19 trajectory groups. Note that there were no patients with positive symptoms at visit 5 and self-reported symptoms were combined with visit 1 symptoms data as they had overlapping dates. Number of patients shown in parentheses.

