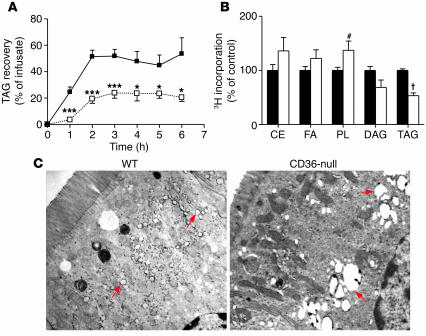
Figure 3.
Lipid trafficking in the intestine. (A) Duodenal and intestinal lymph duct fistulae were surgically implanted in anesthetized WT (filled squares) and CD36-null (open squares) mice (n = 4–6). Following duodenal infusion of the lipid emulsion, lymph was collected from the lymph duct fistula. The amount of TAG mass recovered per hour in the lymph (expressed as a percentage of the infusate) was determined by scintillation spectroscopy. *P < 0.05; ***P < 0.001. (B) Primary enterocytes from anesthetized WT (black bars) and CD36-null (white bars) mice were prepared and pulsed with a lipid mixture containing [3H]oleic acid. The relative incorporation of 3H into microsomal lipids was determined. The combined data from 2 experiments (n = 4 plates per experiment) is shown. CE, cholesteryl ester; DAG, diacylglycerol; PL, phospholipid. #P = 0.03; †P < 0.00001. (C) Fixed segments of the proximal intestine were stained with uranyl acetate and embedded using standard methods. Ultrathin sections were prepared, stained with Reynolds’ lead citrate, and examined under a Hitachi H-600 electron microscope. Red arrows indicate the positions of lipid droplets.

