Figure 4.
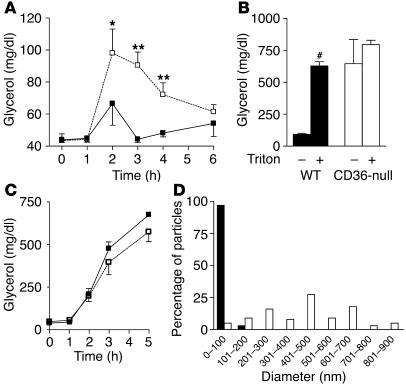
Plasma TAG metabolism in vivo. (A) Postprandial plasma TAGs. WT (filled squares) and CD36-null (open squares) mice (n = 4) received an intragastric gavage of olive oil (16.5 μl/g). Plasma was collected at the indicated time points and TAG levels measured. *P < 0.05; **P < 0.001. (B) Effect of triton on postprandial plasma TAGs. WT (black bars) and CD36-null (white bars) mice (n = 3) received i.p. injections of saline or triton 30 minutes before an intragastric gavage of olive oil (16.5 μl/g) was administered. Plasma was collected 3 hours after injection and TAG levels measured. #P < 0.0001. (C) Effect of triton on fasting plasma TAGs. WT (filled squares) and CD36-null (open squares) mice (n = 4) received i.p. injections of triton. Plasma was collected at the indicated time points and TAG levels measured. (D) Chylomicron size after an oral fat load. Chylomicrons were isolated from the plasma of WT (black bars) and CD36-null (white bars) mice 3 hours after an intragastric gavage of olive oil (16.5 μl/g). Particle size was determined by negative-staining electron microscopy.

