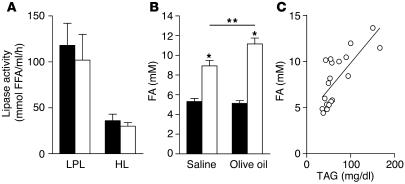
Figure 6.
Postheparin lipase activity and plasma FA levels. (A) LPL and HL activity. WT (black bars) and CD36-null (white bars) mice (n = 5) received i.p. injections of heparin. After 30 minutes, plasma was collected and lipase activity measured. (B and C) Plasma FA levels correlate with plasma TAG levels. Fasted WT (black bars) and CD36-null (white bars) mice (n = 4–6) received olive oil (3.5 μl/g) by gavage. Plasma was harvested 2–3 hours after gavage. Plasma FA levels were measured (B) and correlated with plasma TAG levels (C). *P < 0.001; **P < 0.02.

