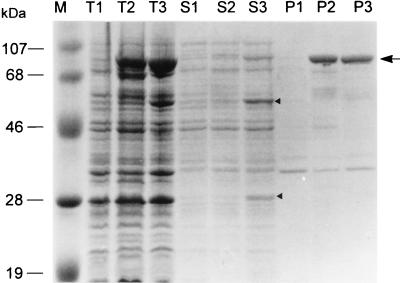
FIG. 3.
SDS-PAGE analyses of the expression and processing patterns of TGA fusion proteins. Lane M, molecular mass markers; lanes T1 to T3, total cell extracts; lanes S1 to S3, soluble fractions; lanes P1 to P3, insoluble fractions from pTrxFus (vector)-, pTSG-, and pTNSG-harboring E. coli GI724, respectively. The upper and lower arrowheads in lane S3 denote the processed 54-kDa β subunit and 32-kDa TGα subunit, respectively. The arrow indicates each unprocessed 86-kDa protein aggregate.

