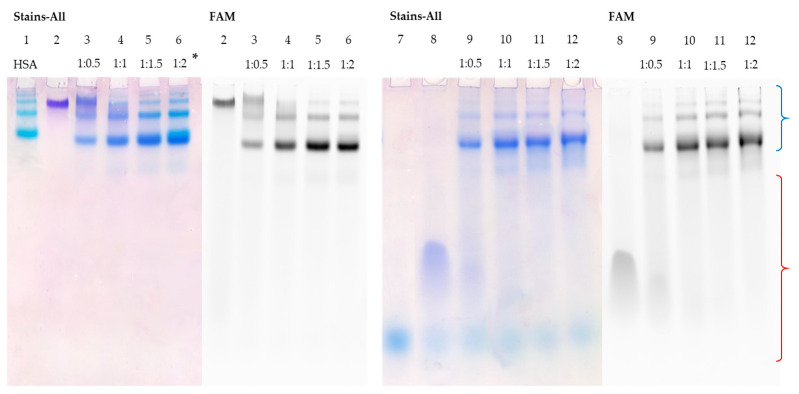
Figure 3.
Detection of HSA complexes with FAM-TZD16 and FAM-TZD16/M16 by EMSA; oligonucleotide samples contained 10 µM oligomer; * indicates an ON:HSA ratio. HSA (lane 1), FAM-TZD16 (lane 2), FAM-TZD16 + HSA (lanes 3–6), M16 (lane 7), FAM-TZD16/M16 (lane 8), and FAM-TZD16/M16 + HSA (lanes 9–12). Region-corresponding mobilities of the HSA–oligonucleotide complexes under the conditions used are marked with a blue curly bracket, and the range of mobility of free oligonucleotides is marked with a red curly bracket.

