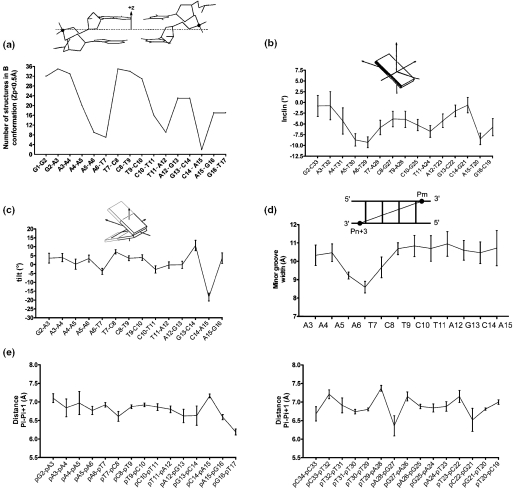
Figure 4.
(a) Profiles of the local number of B-DNA structures (Zp value inferior to 0.5 Å) among the 36 RDC structures [calculated with 3DNA (42)]. A schematic definition of Zp is given in insert (41); (b) Profile of the global base pair axis inclinations of the 36 RDC structures (see legends in Figure 3 and Table 2), values being calculated with CURVES (39); (c) Profiles of local inter base (intrastrand) tilts in the upper strand of the 36 RDC structures (see legend in Figure 3), values being calculated with CURVES (39); (d) Profile of the average interstrand phosphorus–phosphorus (Pm–Pn+3) distances (illustrating the minor groove width) from the 36 RDC structures (see legend in Figure 3), calculated with 3DNA (42); (e) Profiles of intrastrand phosphate–phosphate Pi–Pi+1 distances along the upper strand (left) and the lower strand (right).

