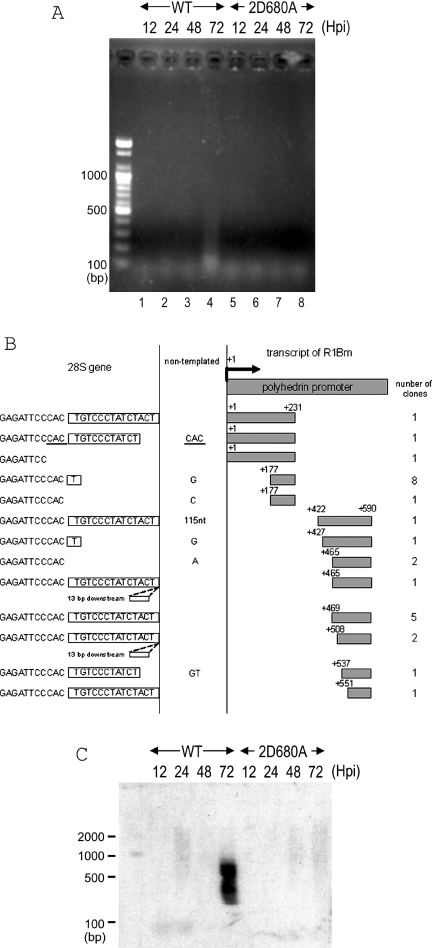
Figure 4.
5′-junction analysis for retrotransposed R1 elements. (A) PCR amplification of the boundaries of the transposed R1 5′ ends with the 28S gene. The DNA extraction and PCR analyses were basically same as in Figure 3. A pair of primers, +590 and 28S(−62) was used for amplifying the 5′ junctions. 2D680A, RT-deficient mutant (Figure 2A). (B) 72 h.p.i. 5′ junction obtained with wild-type R1. Shown at the top of the figure is a diagram of the 5′ end structure of R1WT-pAcGHLT. Sequences derived from the pAcGHLTB vector are indicated by shaded boxes. The numbers on the left and the right of the shaded boxes correspond to the nucleotide position numbered with the transcription initiation site. The gray boxes on the right are cDNA and the open boxes on the left are the 28S rDNA regions. Extra nucleotides at the junction that are not derived from either the 28S gene or the R1 construct are given between two vertical lines. Boxes to the left of the vertical lines represent the 14 bp of TSD. Duplicated nucleotides are underlined. Two of the insertions contained 13 bp downstream sequences at the insertion site. The number of clones containing each insertion type is indicated in the right-most column. The top five sequences are from PCR with primer +231, and the bottom eight sequences are from PCR with primer +590. (C) Southern hybridization of the retrotransposed R1 5′ junction PCR. The PCR reaction was conducted by primers +590 and 28S (−137). The PCR products were transferred to a nylon membrane and hybridized with the GST probe (Figure 2A). The DNA size marker was electrophoresed simultaneously and shown on the left.

