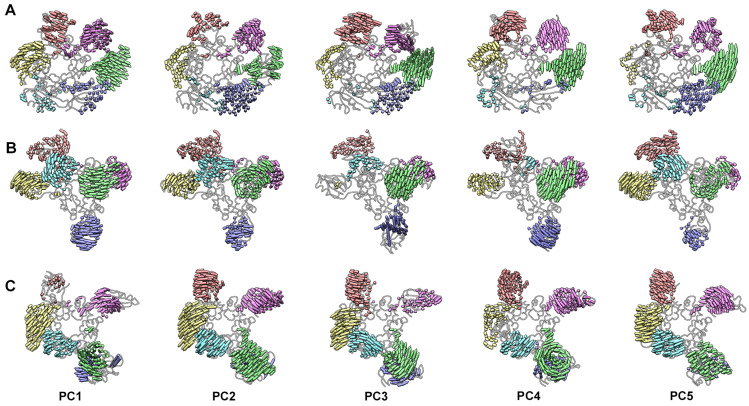
Figure 4.
Porcupine plots from PCA of the ED-OD from the three simulations. The pegs (vectors) are color coded according to Figure 1. Only pegs longer than 2 Å are shown. PCV2 is shown as a licorice with silhouettes. ED-OD is shown with ED closest to and OD distal to the viewer. Shown are PC1-PC5. (A) Rep-(ssDNA + ADP), (B) Rep-ssDNA, and (C) Rep.

