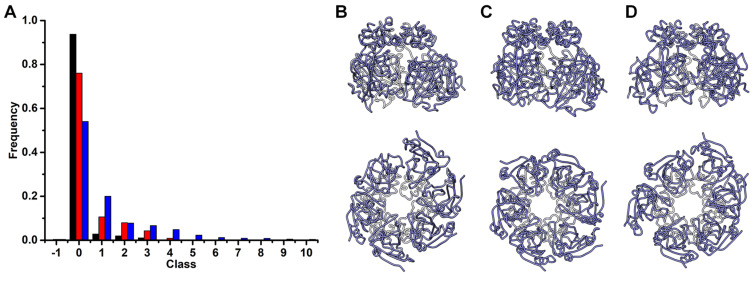
Figure 7.
Quality Threshold clustering. (A) Bar graph showing the number of members per cluster at a quality threshold of 1.8 Å. The bars are color coded similar to Figure 1 (black: Rep-(ssDNA + ADP), red: Rep-ssDNA, blue: Rep). Licorice representations of centroids from first cluster of (B) Rep-(ssDNA + ADP), (C) Rep-ssDNA, and (D) Rep. Top panel are side views, and bottom panel are bottom views, the same orientation as Figure 6. The staircase arrangement is maintained in the largest cluster of the Rep-(ssDNA + ADP) and Rep-ssDNA but not Rep simulation.

