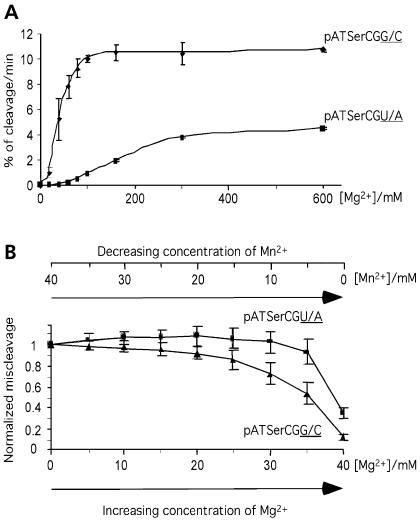
Figure 4.
Cleavage of pATSerCGG/C and pATSerCGU/A by M1 RNA at different concentrations of Mg2+ (A) and [Mg2+]/([Mg2+] + [Mn2+]) ratios (B). (A) Cleavage rates pATSerCGG/C and pATSerCGU/A expressed as percentage of cleavage per minute. (B) Normalized miscleavage at −1 of pATSerCGG/C and pATSerCGU/A as a function of [Mg2+]/([Mg2+] + [Mn2+]) as indicated. The total divalent metal ion concentration was kept constant at 40 mM and the concentrations of Mg2+ and Mn2+ were varied as indicated. The curves are averages of several independent experiments and the bars indicate experimental errors. The experiments were performed at 37°C as outlined in Materials and Methods under single turnover conditions at pH 6.1. pATSerCGG/C = triangles; pATSerCGU/A = squares.

