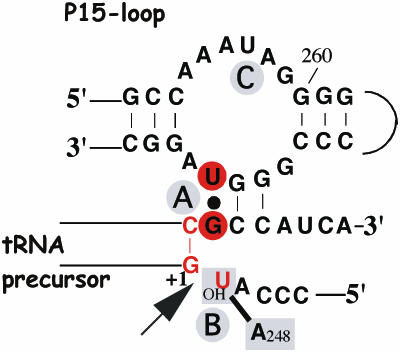
Figure 5.
Illustration of the ‘RCCA–RNase P RNA interaction’ (interacting residues underlined) and the interaction between A248 and residue −1 in the substrate, the ‘A248/N−1 interaction’ [for details see the text and (14,22), and references therein]. The residues indicated in red correspond to those that were replaced in this report. The residues in red circles show the ‘+73/294 interaction’ while the arrow mark the canonical RNase P cleavage site at +1. In the case of the C−1 variants, C−1 is inferred to base pair with G+73 in the absence of RNase P RNA. A and B (in gray circles) represent Mg2+ ions that have been suggested to be positioned at and in the vicinity of the cleavage site [(22) and references therein] while C is an additional ion positioned in the P15-loop. The 2′-OH at the −1 position has been suggested coordinating Mg2+ at the cleavage site, and/or interacting with RNase P RNA (14,15,22,28,29,31,34).

