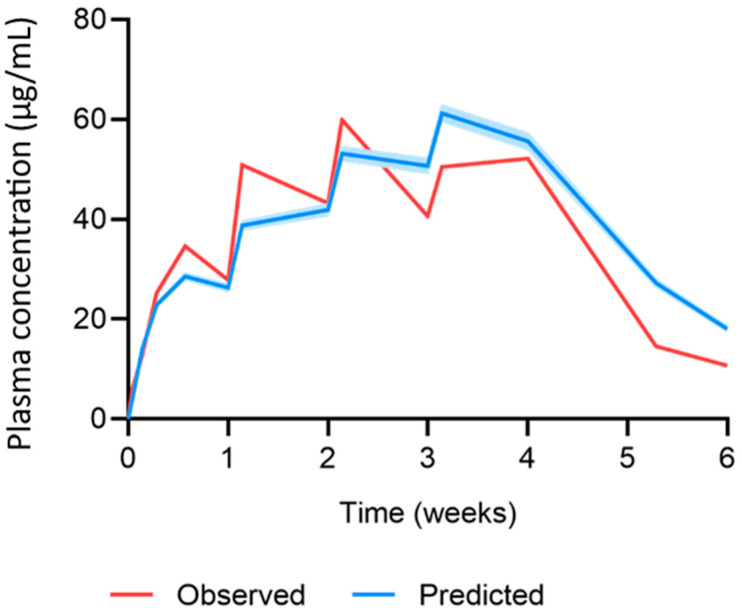
Figure 4.
Observed vs. predicted concentration time profile of cabotegravir after once-weekly-dose MAP administration of 11.72 mg cabotegravir in rats. The red line represents the mean of the observed clinical data (µg/mL) [25]. The blue line and shaded area represent the mean plasma concentration ± standard deviation (µg/mL) of the predicted data.

