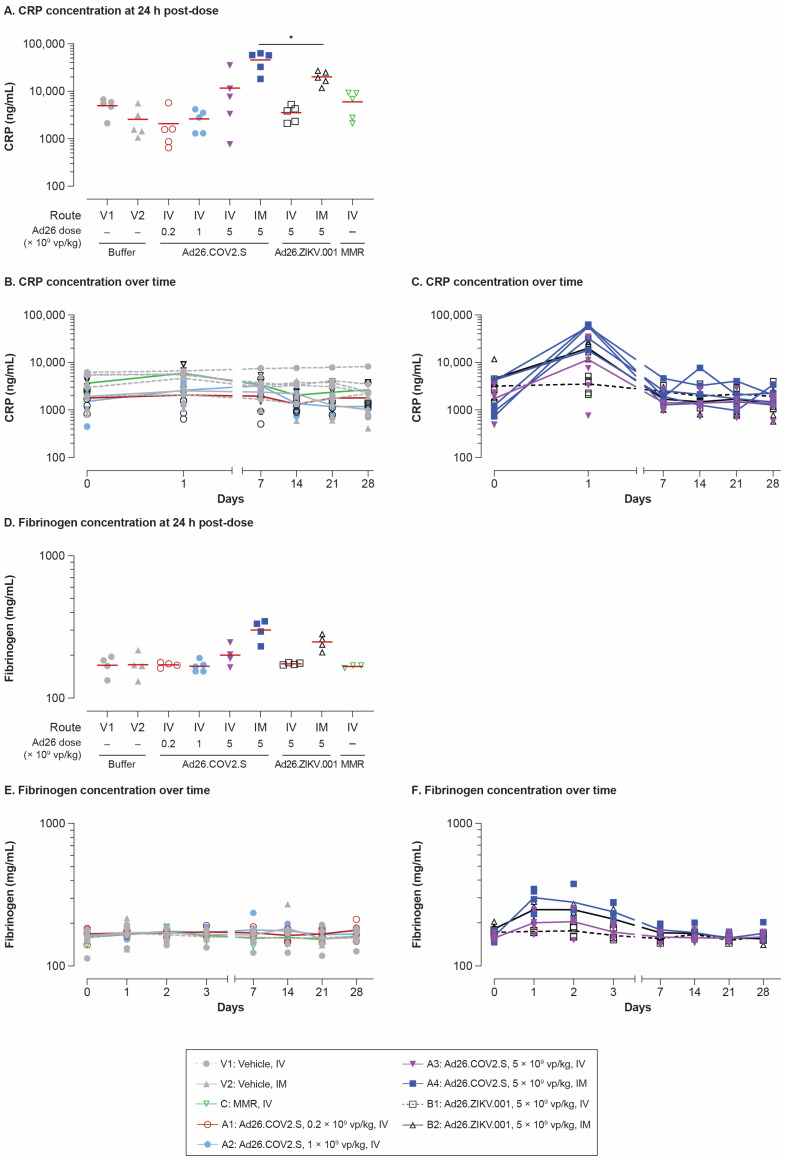
Figure 2.
CRP and fibrinogen levels after IV and IM administration with Ad26.COV2.S and other vaccines in rabbits. Individual animal CRP (A–C) and fibrinogen (D,F) levels were measured in serum taken at the indicated time points pre- and post-dosing with the same vaccines, as indicated in the Figure 1 legend. (A,D) show CRP and fibrinogen levels at 24 h; horizontal lines represent respective group means. ANOVA testing was performed by comparing IM Ad26.COV2.S (A4) with IM Ad26.ZIKV.001 (B2). (B,E) show the time course data from groups V1, V2, C, A1, and A2, with lines representing the group mean and symbols corresponding to individual animals (n = 5/group) for each time point evaluated. (C,F) show the time course data from groups A3, A4, B1, and B2. * p < 0.05. ANOVA, analysis of variance; CRP, C-reactive protein; IM, intramuscular; IV, intravenous; MMR, measles–mumps–rubella; vp, viral particles.

