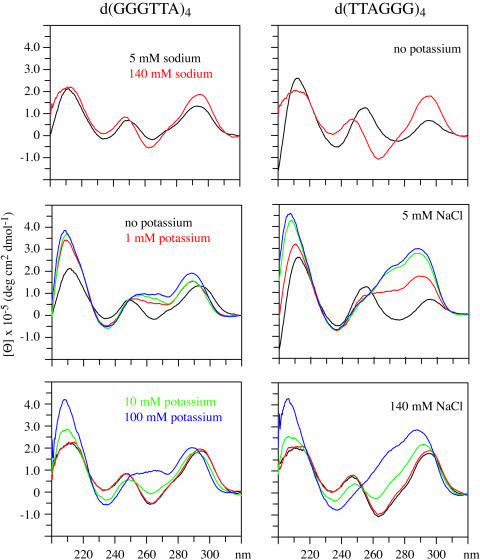
Figure 4.
The CD spectra of d(GGGTTA)4 and d(TTAGGG)4 in the presence of 5 and 140 mM sodium are shown in the upper panels. The CD spectra of these DNAs in the presence of 5 mM sodium with 0, 1, 10 or 100 mM potassium are shown in the middle panels. In the lower panels, the CD spectra of these DNAs in the presence of 140 mM sodium with 0, 1, 10 or 100 mM potassium are shown.

