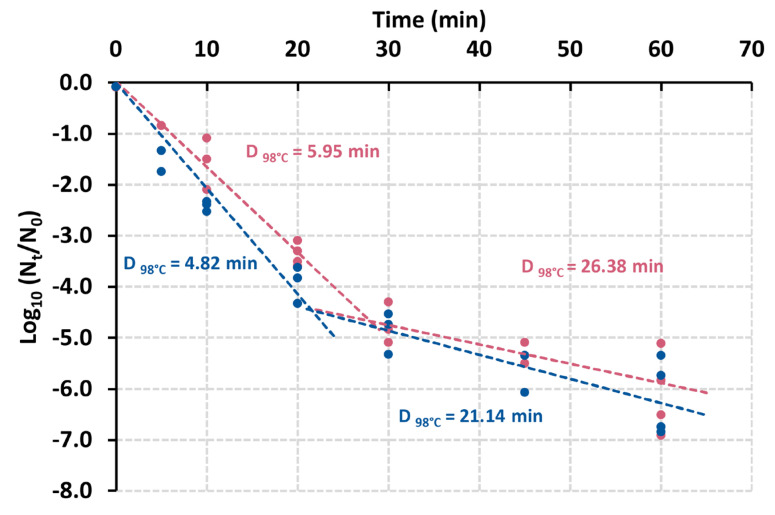
Figure 6.
Thermal destruction of C. botulinum ST7B spores (pink dots) and V73 spores (blue dots). Purified spore suspensions were adjusted at OD600nm 1 and heat-treated at 98 °C for different incubation times. D-values were obtained from the linear regression lines for each dataset. We observed the presence of two spore subpopulations, as shown with the two distinct destruction curves fitted on the data of each strain. The heat resistance of V73 spores appeared generally slightly lower than that of ST7B spores; however, the difference was statistically significant (p < 0.05, t-test) only for the most heat-sensitive spore subpopulations depicted during the first 20 min of the experiment.

