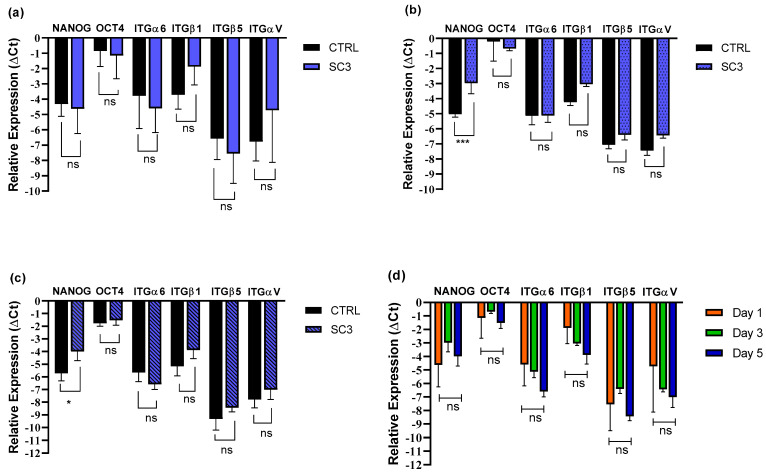
Figure 8.
Plots depicting gene expression of: (a–c) iPSCs incubated on solvent-casted scaffolds SC3 (PCL 85% + PLGA 15%) as compared to control on day 1, 3, 5, respectively; (d) iPSCs incubated on SC3 scaffolds as compared to day 1, 3 and 5. Statistical analysis by one-way ANOVA analysis with Sidak’s correction (significance of the results by the p-value as ns = p > 0.05, * = p < 0.05, *** = p < 0.001).

