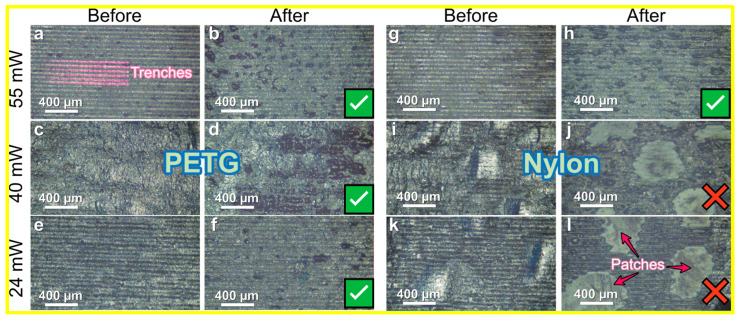
Figure 2.
Optical microscopy images of the rGO films on PETG (a–f) and nylon (g–i) treated under different laser powers before (a,c,e,g,i,k) and after (b,d,f,h,j,l) washing in an ultrasound bath. The marks at the bottom right corner indicate the samples’ conductivity (check mark—conductive, cross mark—not conductive). Images for other polymers are presented in the SI.

