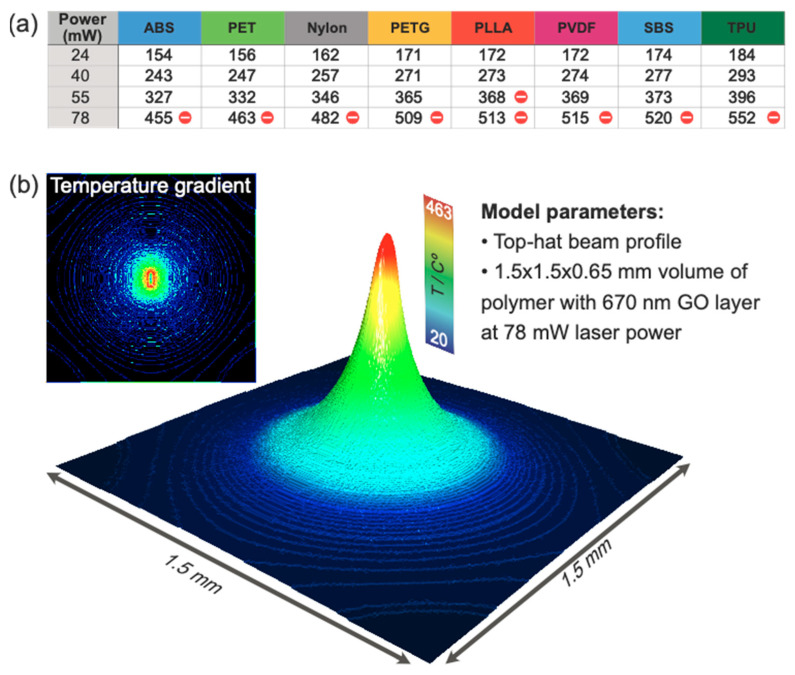
Figure 3.
(a) Maximum polymer temperature in °C after 0.25 s of laser heating with different powers. The cells marked with red ticks indicate the destructive regime with a maximum temperature exceeding Td. (b) 3D image is a temperature map obtained by computer modeling of polymer heating under the laser treatment. The PET with GO film was taken as an example. In the inset is the temperature gradient map illustrating the high spatial confinement of temperature gradients responsible for mass flows due to the Marangoni effect.

