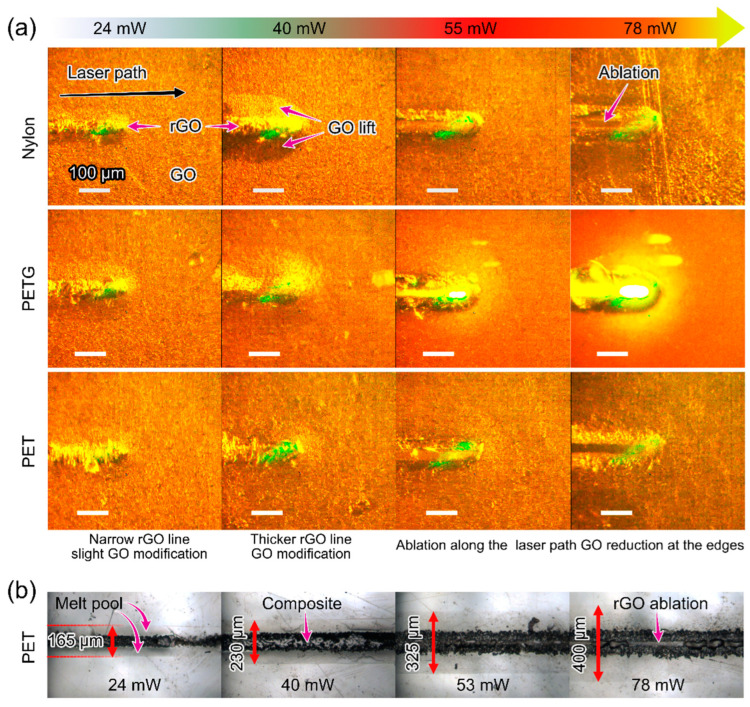
Figure 5.
(a) High-speed shots recorded during laser processing GO films on polymers at different laser powers. The green flashes originate from the laser spot. The scale bar is 100 µm. (b) Optical microscopy images of the laser path on GO/PET after ultrasound cleaning show different dominant effects as laser power increases. The red arrows show the melt pool size that extends far from the laser-irradiated region. Images for all other polymers are presented in the SI.

