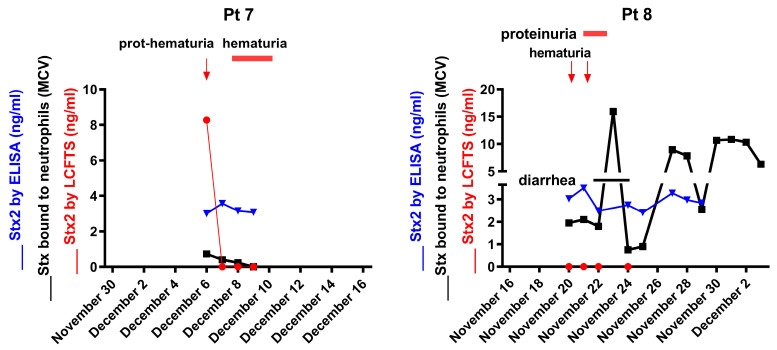
Figure 5.
Time-course analysis of cleaved Stx2 detection in two STEC-infected patients. Stx2 on neutrophils (black) was detected by indirect flow cytometric analysis, the amount of Stx2 (blue) in patients’ sera was measured by ELISA and the amount of cleaved Stx2 (red) was measured by LCFTS. The presence of clinical manifestations such as diarrhea (solid horizontal line) and proteinuria/hematuria (red horizontal lines or red arrows) was also shown. Numbers at the top of each panel identify the patient listed in Table 1.

