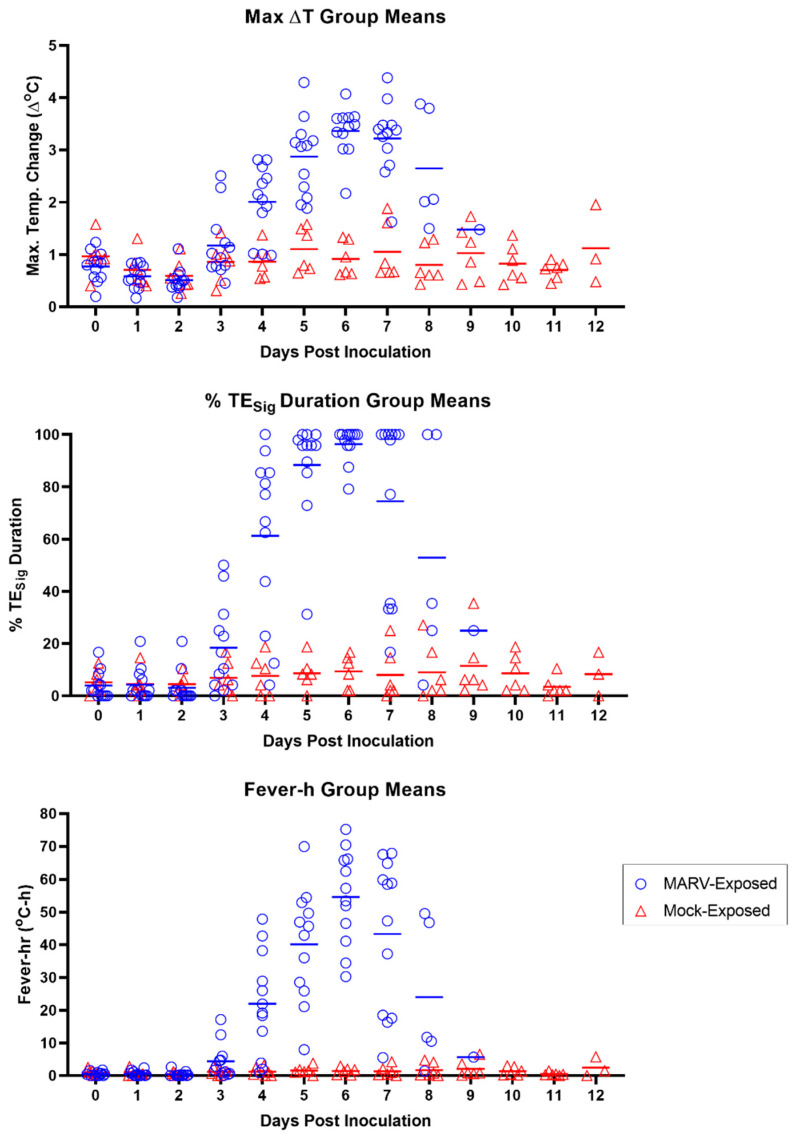
Figure 6.
Body Temperature Measured by Telemetry. Results of the individual MARV-exposed (blue open circles) and mock-exposed (red open triangles) animals for the maximum daily temperature elevation value (∆TMax; top panel), daily percentage of significant temperature elevation values (TESig; middle panel), and daily fever-hours (fever-h; bottom panel). Days post-inoculation = calendar days. Horizontal bars in all panels represent group means.

