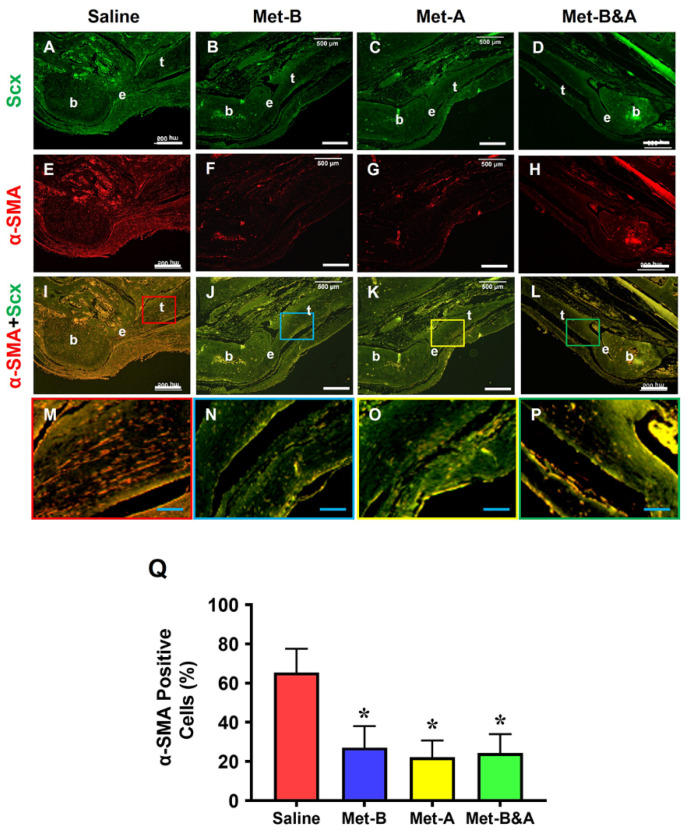
Figure 5.
Met injection inhibits α-SMA+ cell migration. The histological analysis of mouse tendon tissues showed a lot of α-SMA+-stained cells (red) in the saline-treated group (E,I,M). However, a smaller number of α-SMA+-stained cells was found in the wounded tendons of mice with Met injections (F–P) compared to the saline-treated group. There was no significant difference in Scx+ cells (green fluorescent cells) in the wound areas of all four groups (A–D). Semi-quantification results indicated that over 65% of α-SMA+-stained cells were present in the tendon tissues in the saline group. However, 27.1% of the cells in the Met-B group, 22.4% of the cells in the Met-A group, and 24.26% of the cells in the Met-B&A group were positively stained for α-SMA (Q). * p < 0.01 compared to saline. Each of the small boxes, presented in four different colors (I–L) is correspondingly enlarged in the larger boxes (M–P). White bars: 500 µm; blue bars: 125 µm. Met-B: Met-Before; Met-A: Met-After; Met-B&A: Met-Before-and-After; t: tendon; b: bone; e: enthesis.

