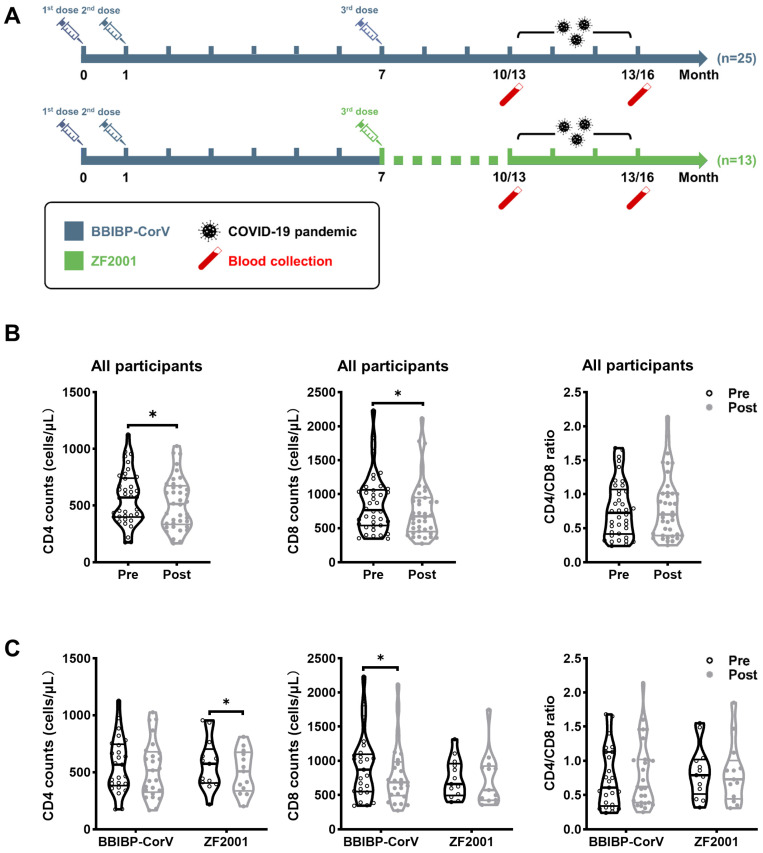
Figure 1.
Study design and dynamics of CD4 counts, CD8 counts, and CD4/CD8 ratio during SARS-CoV-2 breakthrough infection. (A) The schematic diagram described the vaccination strategy in which the first two doses of BBIBP-CorV were injected intramuscularly with a 28-day interval and the homologous booster BBIBP-CorV or heterologous booster ZF2001 was administered 6 months after the second dose. The COVID-19 pandemic occurred 10 or 13 months after the first dose. Blood samples were collected in the 10th/13th and 13th/16th month. Comparisons of CD4 counts, CD8 counts, and CD4/CD8 ratio within all participants (B) and within the BBIBP-CorV homologous booster and ZF2001 heterologous booster groups (C) were made between pre- and post-breakthrough infection. Data were analyzed using the Mann–Whitney U test and paired t-test. * p < 0.05.

