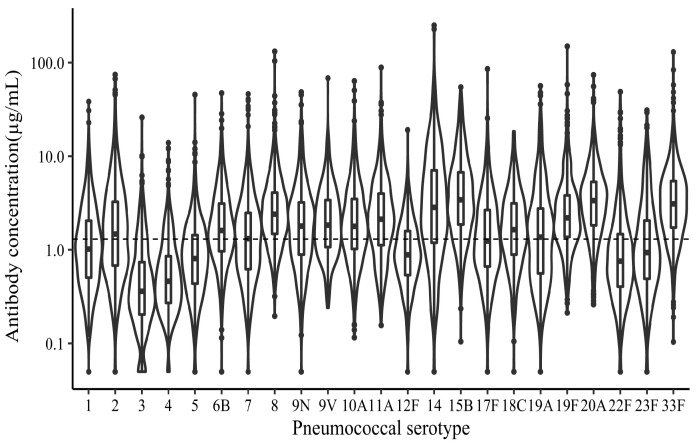
Figure 1.
Distribution of IgG antibody concentrations of the 23 pneumococcal serotypes before vaccination. Violin plot of IgG antibody concentrations for each of PPSV23-related serotypes. Box and whisker plot of median antibody concentrations, interquartile ranges (25th and 75th percentiles), and minimum/maximum values. Antibody concentration is shown on the log scale, dashed line drawn at the value of 1.3 µg/mL.

