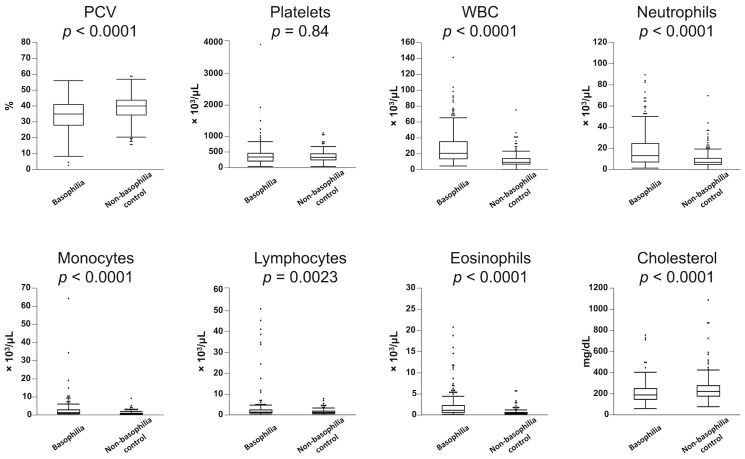
Figure 1.
Comparison of hematological parameters between the 224 dogs with moderate-to-marked basophilia (basophilia group) and the 224 control dogs without basophilia (non-basophilia control group). Box plots indicate 25th to 75th percentiles, with whiskers indicating the minimum and maximum values within the 1.5 interquartile range and dots showing outliers.

