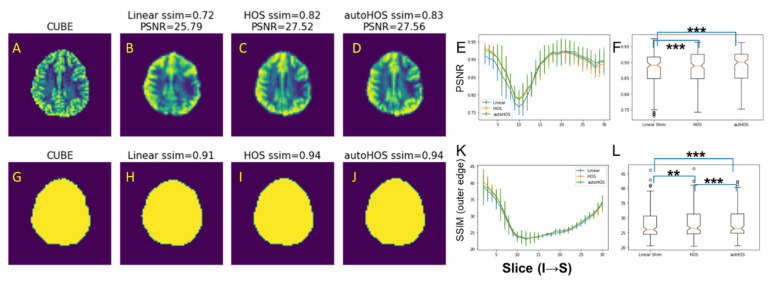
Figure 3.
HOS and autoHOS reduce EPI image distortions at 3T. (A–D) and (G–J) display representative slices of the reference T2-weighted CUBE images (A,G), EPI images acquired with linear shimming (B,H), HOS (C,I), and autoHOS (D,J). The top row (A–D) and bottom row (G–J) showcase the EPI images and the corresponding outer edge of the brain in the EPI images, respectively. Panels (E) and (K) illustrate the PSNR and SSIM of the outer brain contour, respectively. Panels (F) and (L) depict comparisons of global PSNR and SSIM of outer brain contour, respectively. (** p < 0.01, *** p < 0.001).

