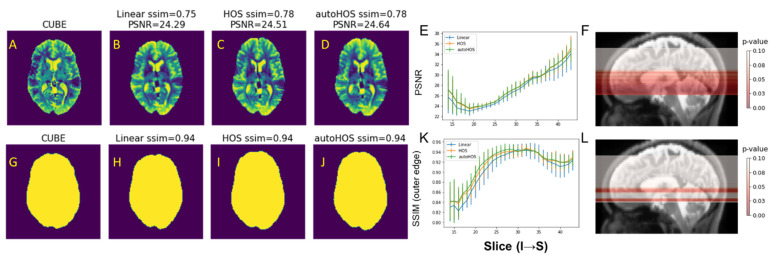
Figure 4.
HOS and autoHOS reduce EPI image distortions at 7T. (A–D) and (G–J) display representative slices of the reference T2-weighted CUBE images (A,G), EPI images acquired with linear shimming (B,H), HOS (C,I), and autoHOS (D,J). The top row (A–D) and bottom row (G–J) showcase the EPI images and the corresponding outer edge of the brain, respectively. Panels (E) and (K) illustrate the PSNR and SSIM of the outer brain contour, respectively. Panels (F) and (L) highlight slices in which both HOS and autoHOS demonstrate significant improvement, marked in red on sagittal view anatomical MRI, for PSNR and SSIM of the outer brain contour, respectively.

