Figure 7.

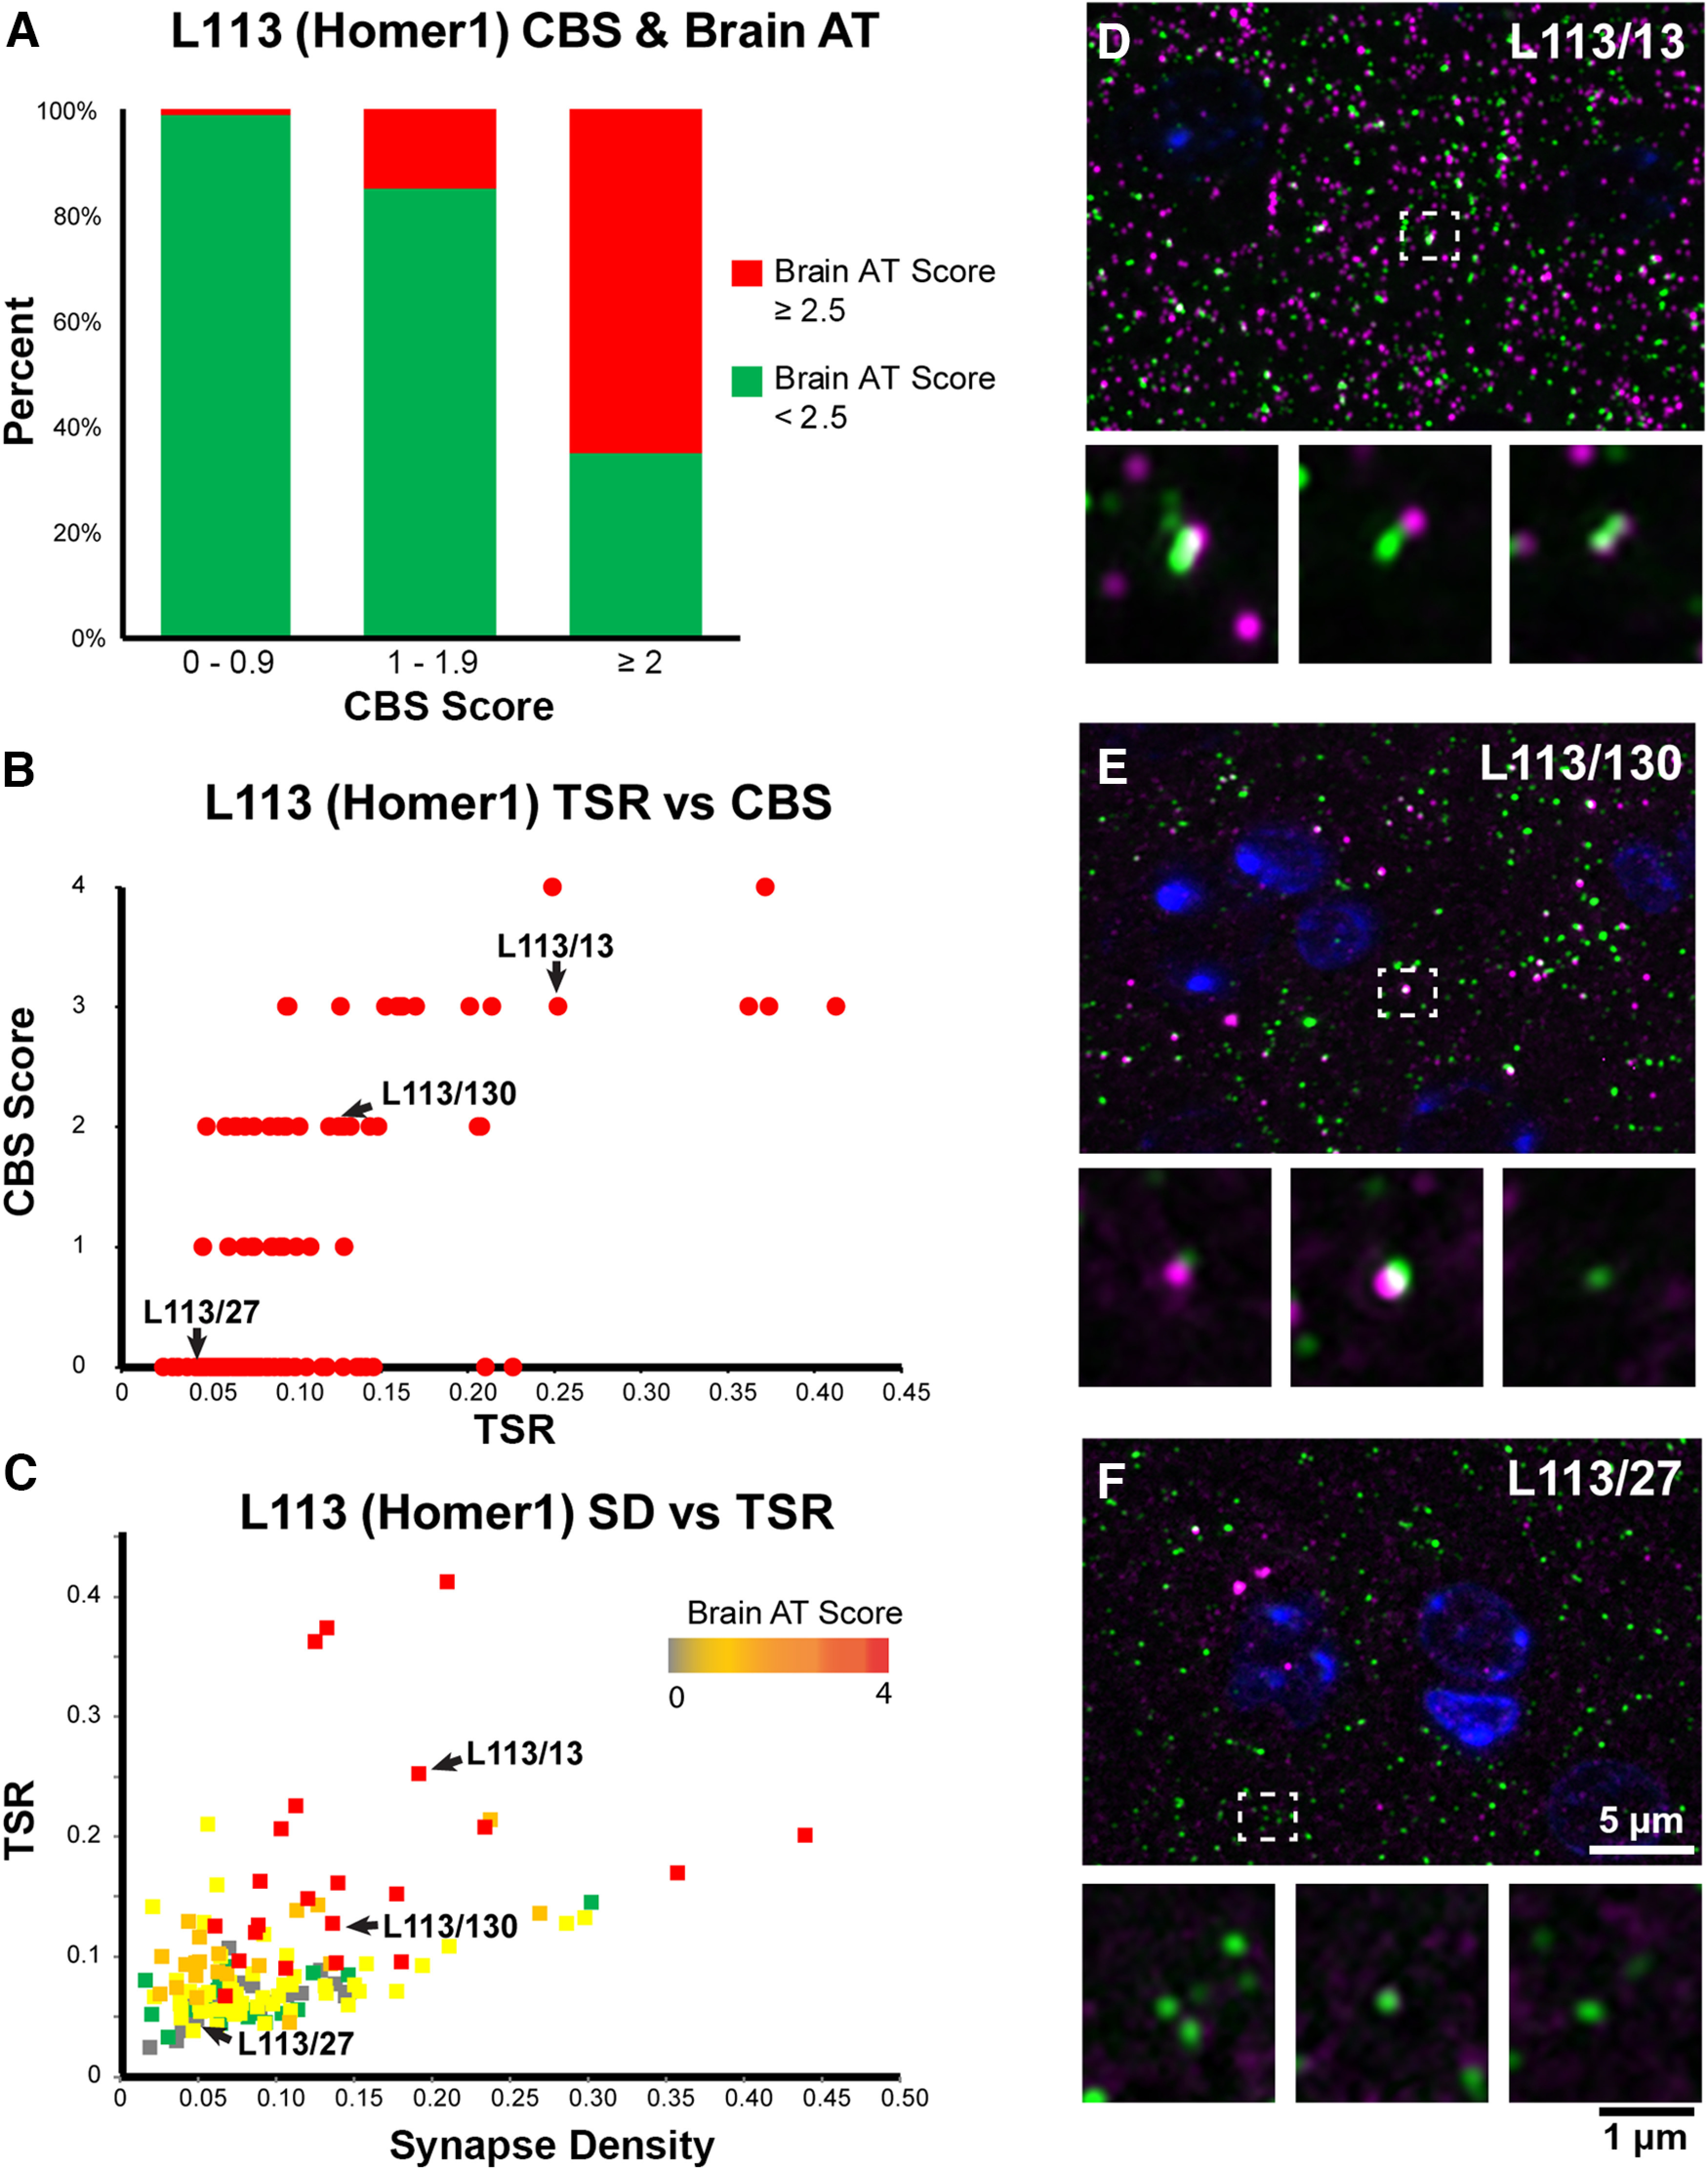
CBS positive mAbs screened on brain tissue embedded for AT. A, Percent of candidate mAbs with high brain AT score among mAbs with different CBS scores. Candidate mAbs with low CBS scores (0–1 and 1–2) are very unlikely to have a high brain AT score, while the majority of candidate mAbs with high CBS scores also scored high on brain AT. B, Correlation between TSR scores which measure Ab specificity in AT brain labeling, and CBS scores. C, Target synapse density which measures the Ab sensitivity in AT brain labeling plotted against the TSR scores. D–F, Images of ultrathin sections from LR White-embedded mouse neocortex immunolabeled with the Homer1L mAbs (magenta) L113/13 (D), L113/130 (E; both CBS positive), and the CBS negative L113/27 (F), double labeled with a PSD95 Ab (green). Nuclei are labeled with DAPI (blue). The bottom of each panel includes examples of individual synapses with three serial sections through each of the AT samples. Similar to their performance in the CBS assay (Fig. 5), mAbs L113/13 and L113/130 show specific labeling on AT brain sections, while L113/27 does not detect the target protein.
