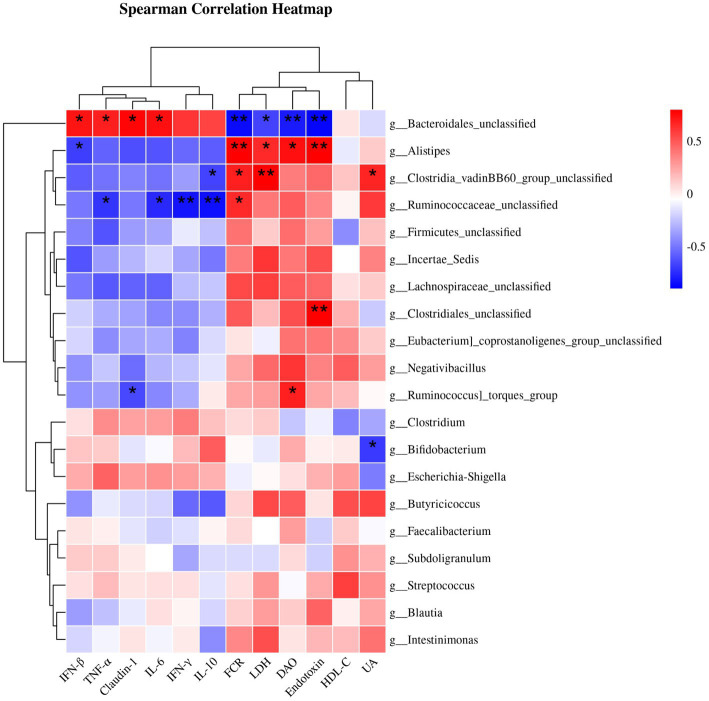
Figure 2.
Spearman correlation analysis of cecal microbiota and FCR or serum differential metabolites or genes with significant differences in jejunal mucosa. Statistically significant associations (p < 0.05) were observed between certain indicators and bacterial genera. The red blocks indicate positive correlations, while the blue blocks indicate negative correlations. The intensity of the colors reflects the strength of the correlations. * p < 0.05 and ** p < 0.01 indicate significant differences compared to the CON group. IFN-β, interferon-β; TNF-α, tumor necrosis factor-α; IL-6, interleukin-6; IFN-γ, interferon-γ; IL-10, interleukin-10; FCR, feed conversion ratio; LDH, lactate dehydrogenase; DAO, diamine oxidase; HDL-C, high-density lipoprotein cholesterol; UA, uric acid; CON, control; CHM, Chinese herbal medicine.

