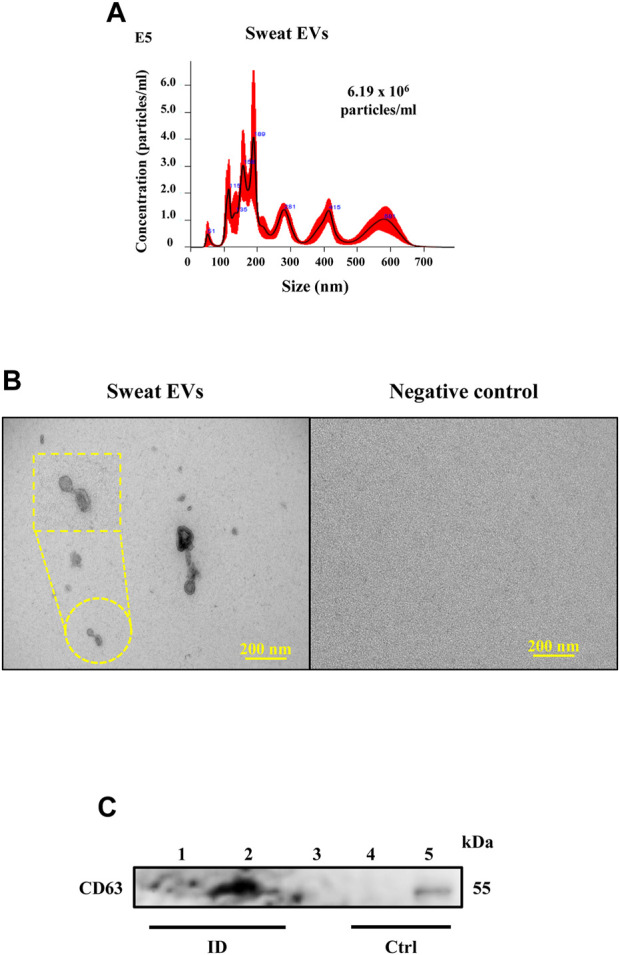
FIGURE 2.

Characterization of sweat EVs. (A). NTA analysis of sweat EVs isolated from healthy participants during the exercise test. (B). Electron microscopy analysis. Negative staining of sweat EVs isolated from patches, control refers to the negative patch (has not been attached to the patient) but processed in the same way as the positive patches. Scale bar = 200 nm. (C). Western blot analysis of CD63 in sweat EVs isolated from two healthy participants during exercise test (lanes 1 and 2). Control lanes (Ctrl) refer to: 1- negative controls (lane 3: 1x PBS and lane 4: non-enriched sweat patch, that has not been attached to a participant, and 2- positive control that refer to EVs extracted from human keratinocytes (lane 5).
