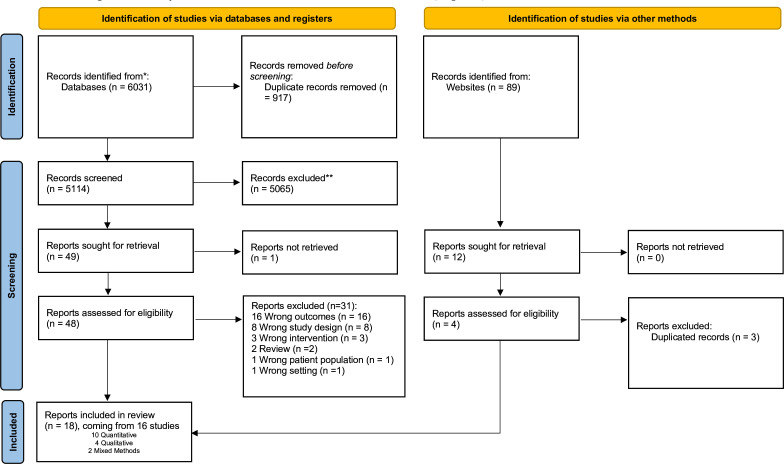
Figure 1.
PRISMA flow diagram. PRISMA flow chart illustrating the number of records included and excluded at various screening and reviewing steps, leading to final list of records for data extraction and meta-analysis.*Consider, if feasible to do so, reporting the number of records identified from each database or register searched (rather than the total number across all databases/registers). **If automation tools were used, indicate how many records were excluded by a human and how many were excluded by automation tools. PRISMA, Preferred Reporting Items for Systematic Reviews and Meta-Analyses.

