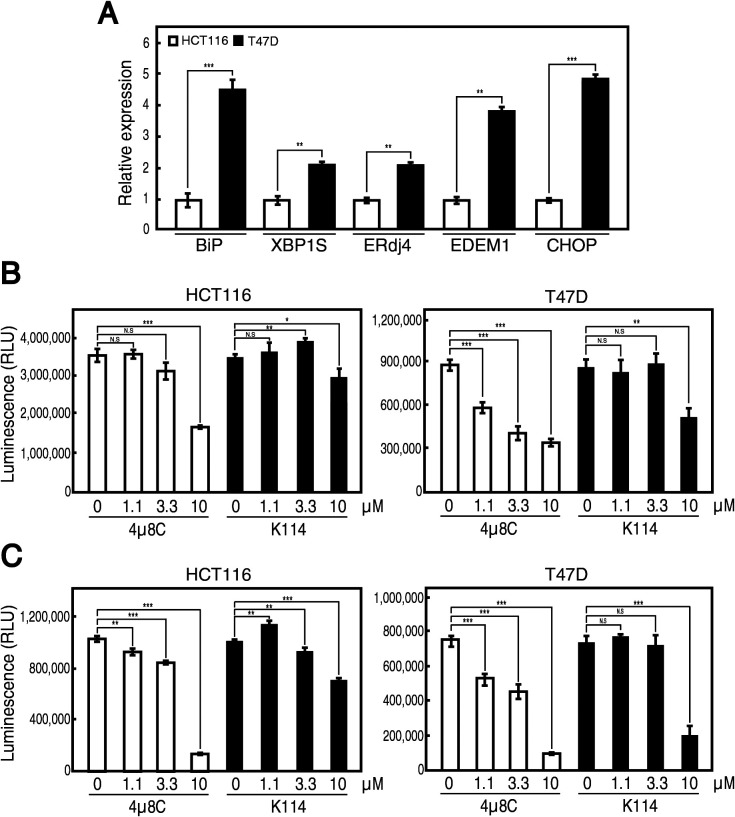
Fig. 4.
Effect of K114 on growth of HCT116 and T47D cells. (A) Total RNA prepared from unstressed HCT116 and T47D cells was subjected to quantitative RT-PCR. The expression level of indicated mRNA is normalized with the level of GAPDH mRNA (n=3). The level of each mRNA in T47D cells is then shown in comparison with that in HCT116 cells. (B) (C) HCT116 and T47D cells were treated with the indicated concentration of 4μ8C or K114 at pH 7.2 (B) or at pH 6.0 (C) for 3 days and subjected to cell growth assay. This experiment was conducted twice (n=3 each). NS, not significant.

