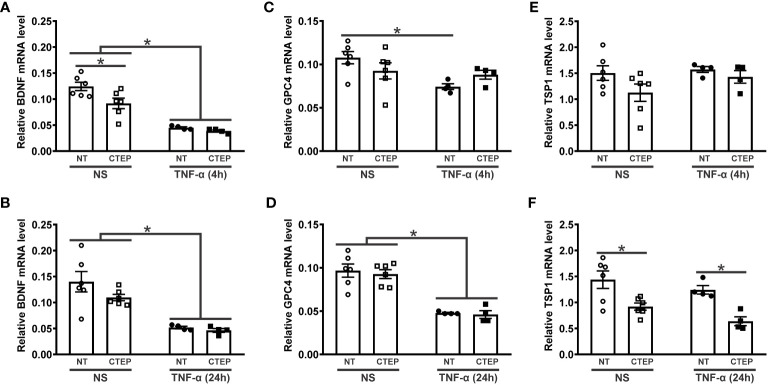
Figure 5.
Both CTEP and rTNF-α decrease the expression of synaptogenic molecules. Graphs show mRNA levels of BDNF (A), glypican-4 (GPC4) (C), and trombospoindin-1 (TSP1) (E) in hiPSC-derived astrocytes that were either unstimulated (NS) or stimulated with rTNF-α 10 ng/mL and treated with either vehicle (NT) or CTEP 10 µM for 4 h. Graphs show mRNA levels of BDNF (B), GPC4 (D), and TSP1 (F) in hiPSC-derived astrocytes that were either unstimulated (NS) or stimulated with rTNF-α 10 ng/mL and treated with either vehicle (NT) or CTEP 10 µM for 24 h. mRNA levels were assessed by quantitative RT-PCR, which was performed in triplicates and normalized to the average of RPLP0 and IPO8 mRNA levels. Data represents the means ± SEM, n=4-6. * (p<0.05) indicates significant differences.

