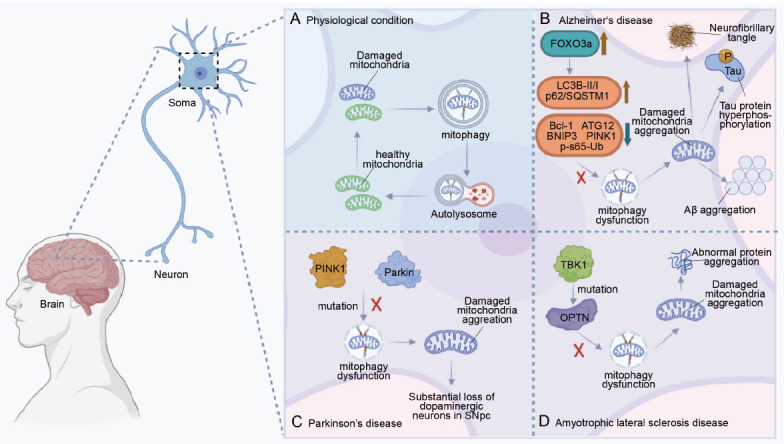
Figure 3.

The schematic diagram of mitophagy in neurological disease pathogenesis.
Soma is depicted with mitophagy under physiological or pathological conditions: physiological condition (A), Alzheimer’s disease (B), Parkinson’s disease (C), Amyotrophic lateral sclerosis (D). (A) Under physiological conditions, neurons clear damaged mitochondria through mitophagy to maintain mitochondrial homeostasis. (B) In the neurons of Alzheimer’s patients, as the active form of FOXO3a in the cytosol increases, some mitophagy-related proteins decline, such as Bcl-1, autophagy-related 32 (ATG32), BNIP3, PINK1, and p-S65-Ub. Levels of LC3B-II/I and p62/SQSTM1 then increase, which leads to impaired mitophagy and ultimately the pathological features of Alzheimer’s, such as neurofibrillary tangles, Tau protein hyperphosphorylation, and Aβ aggregation. Brown arrows represent increases and blue arrows represent decreases. (C) In the neurons of Parkinson’s disease, mutations of Parkin and PINK1 directly lead to mitophagy dysfunction, resulting in substantial loss of dopaminergic neurons in the substantia nigra of Parkinson’s patients. (D) In the neurons of amyotrophic lateral sclerosis patients, mutations of TABK-binding kinase 1 (TBK1) affect the activity of OPTN, leading to mitophagy dysfunction. Thus, changes in OPTN cause the pathological protein aggregation. Created with BioRender.com.
