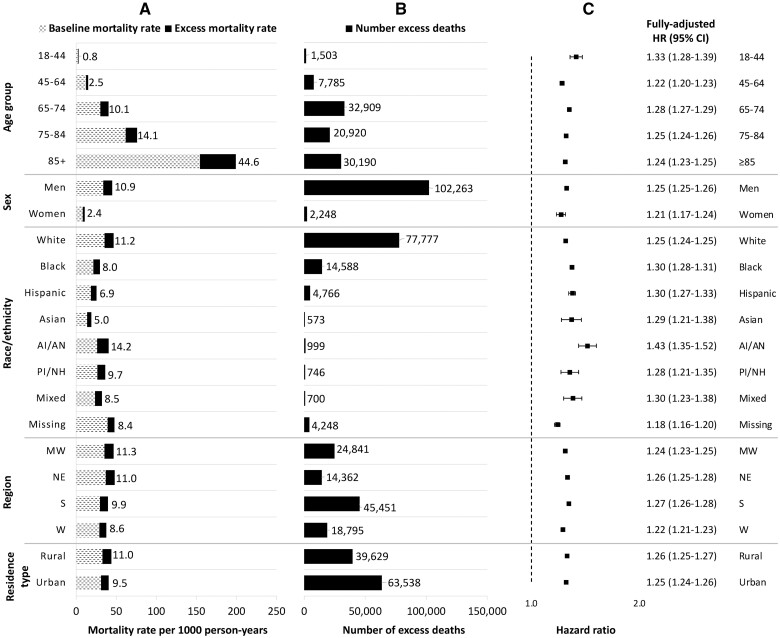
Figure 1.
Mortality rates, number of excess deaths and hazard ratios comparing pre-pandemic and pandemic mortality by demographic subgroup. The numbers of excess deaths are adjusted for the characteristic of interest only. Fully adjusted hazard ratios were derived from a separate Cox model for each characteristic with an interaction between the pandemic time variable and each given characteristic, and adjusted for all demographics, physiologic frailty and comorbidity burden. In (A), the numbers listed refer to the excess mortality rates. HR, hazard ratio; AI/AN, American Indian/Alaska Native; PI/NH, Pacific Islander/Native Hawaiian; MW, Midwest; NE, Northeast; S, South; W, West

