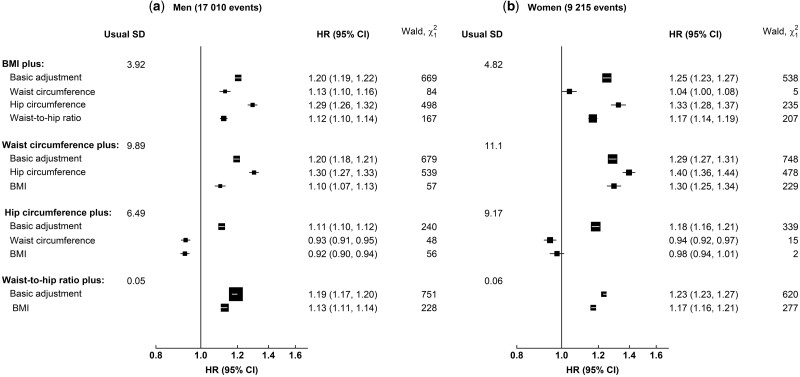
Figure 2.
Adjusted hazard ratios (95% confidence intervals) for coronary heart disease per standard deviation higher adiposity measure before and after mutual adjustments in (a) men and (b) women. Hazard ratios (HRs) were stratified by age at risk and UK region, and adjusted for education, deprivation index, ethnicity, smoking and alcohol consumption. The area of each box is proportional to the amount of statistical information (i.e. it is inversely proportional to the variance of the log-HR). Error bars indicate the 95% CIs. BMI, body mass index

