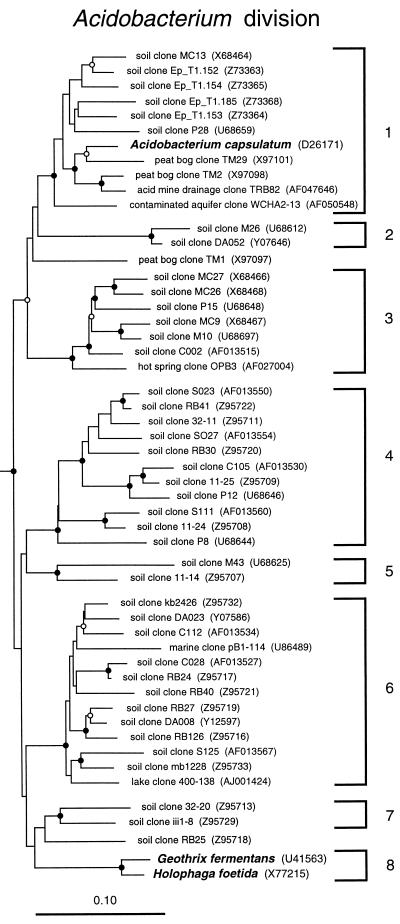
FIG. 3.
Phylogenetic dendrogram of the Acidobacterium division. Names of cultivated organisms are shown in bold. The habitat source of each environmental sequence is indicated before the clone name. GenBank accession numbers are listed parenthetically. Subdivisions (see the text) are indicated by brackets at the right of the tree. Construction of the tree was as described for Fig. 1. The robustness of the topology presented was estimated by bootstrap resampling of independent distance, parsimony, and rate-corrected maximum-likelihood analyses as previously described (2). Distance and parsimony analyses were conducted using test version 4.0d61 of PAUP*, written by David L. Swofford. Branch points supported (bootstrap values of >75%) by most or all phylogenetic analyses are indicated by filled circles; open circles indicate branch points marginally supported (bootstrap values of 50 to 74%) by most or all analyses. Branch points without circles are not resolved (bootstrap values of <50%) as specific groups in different analyses. The scale bar indicates 0.1 change per nucleotide.

